A.3 CHI-SQUARE DISTRIBUTION
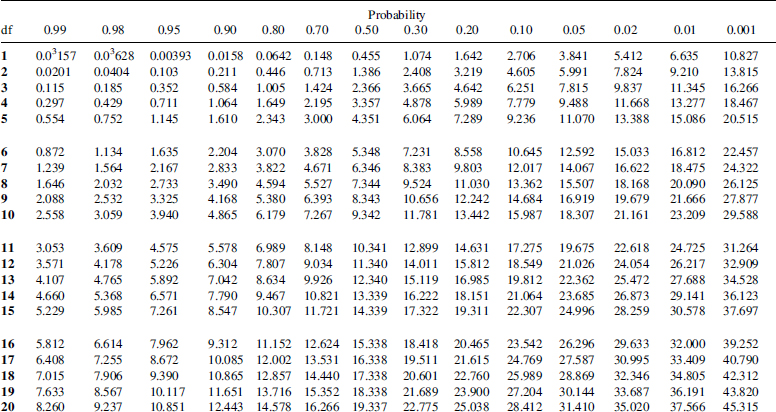
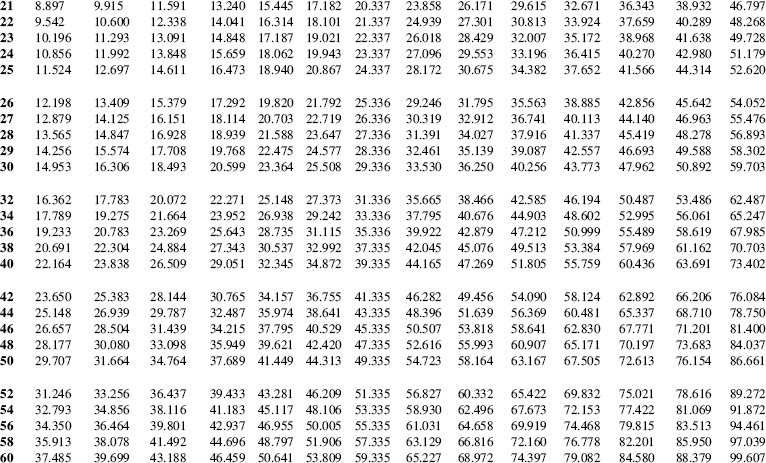
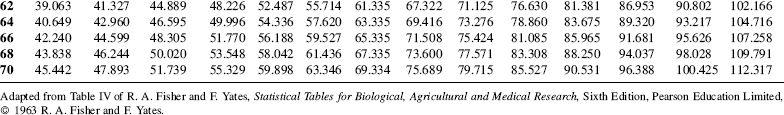
Critical values of χ2 are shown in Table A.3 for various degrees of freedom (df) and illustrated in Figure A.3. The area or probability values (α) to the right of the χ2 values are shown in the table. For example, with 9 degrees of freedom and 0.05 probability (α), the χ2 value would be 16.919.
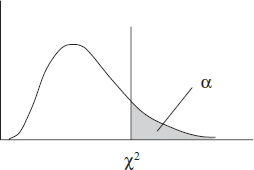
Figure A.3. Chi-square distribution
Table A.3. χ2 distribution
Get Making Sense of Data: A Practical Guide to Exploratory Data Analysis and Data Mining now with the O’Reilly learning platform.
O’Reilly members experience books, live events, courses curated by job role, and more from O’Reilly and nearly 200 top publishers.

