Chapter 14. Charts, Costs, and Other Puzzles
"So what is it?" I asked.
I was sitting at my desk, staring at the page Sheila had just put in front of me. Along the top of the page was a time scale and at the left was a list of all the activities we had talked about at our detailed design planning meeting yesterday. Next to each task, placed somewhere along the time scale at the top of the page, was a solid bar. The bar length was different for each of the different tasks. It looked something like this (although this chart only shows a sample of the tasks we had on ours):
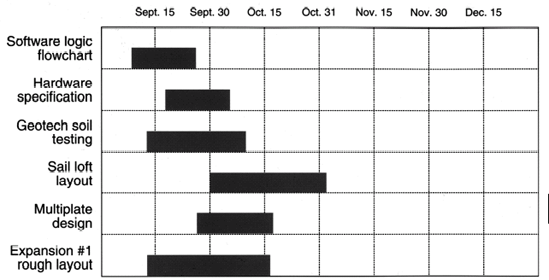
"It's a Gantt chart printout from our project management software program!" Sheila told me. When I looked blank she prodded, "You know, a Gantt chart. Otherwise known as a bar chart or a time line?"
"Of course," I said. "To be honest, I was just a little fooled by the layout. I'm much more used to seeing really messy ones that have been drawn by hand."
"Well, then, this one should look pretty good to you." She was obviously not impressed that I was not impressed. "See," she said pointing to the left-hand side of the page, "there are all of the activities in the detailed design.And those bars," she pointed to the bars, "show when each activity is scheduled to take place, and how long it is planned to be."
Ralph was going to be happy to see this: a computer generated schedule at last! Yesterday, the Monday after ...
Get Making It Happen: A Non-Technical Guide to Project Management now with the O’Reilly learning platform.
O’Reilly members experience books, live events, courses curated by job role, and more from O’Reilly and nearly 200 top publishers.

