To further assist us in choosing a threshold value in a more visual way, we can generate a receiver operator characteristic (ROC) curve. An ROC curve plots the false positive error rate (FPR) against the true positive rate (TPR, or sensitivity) for every threshold value between 0 and 1, as illustrated in Figure 4.4:
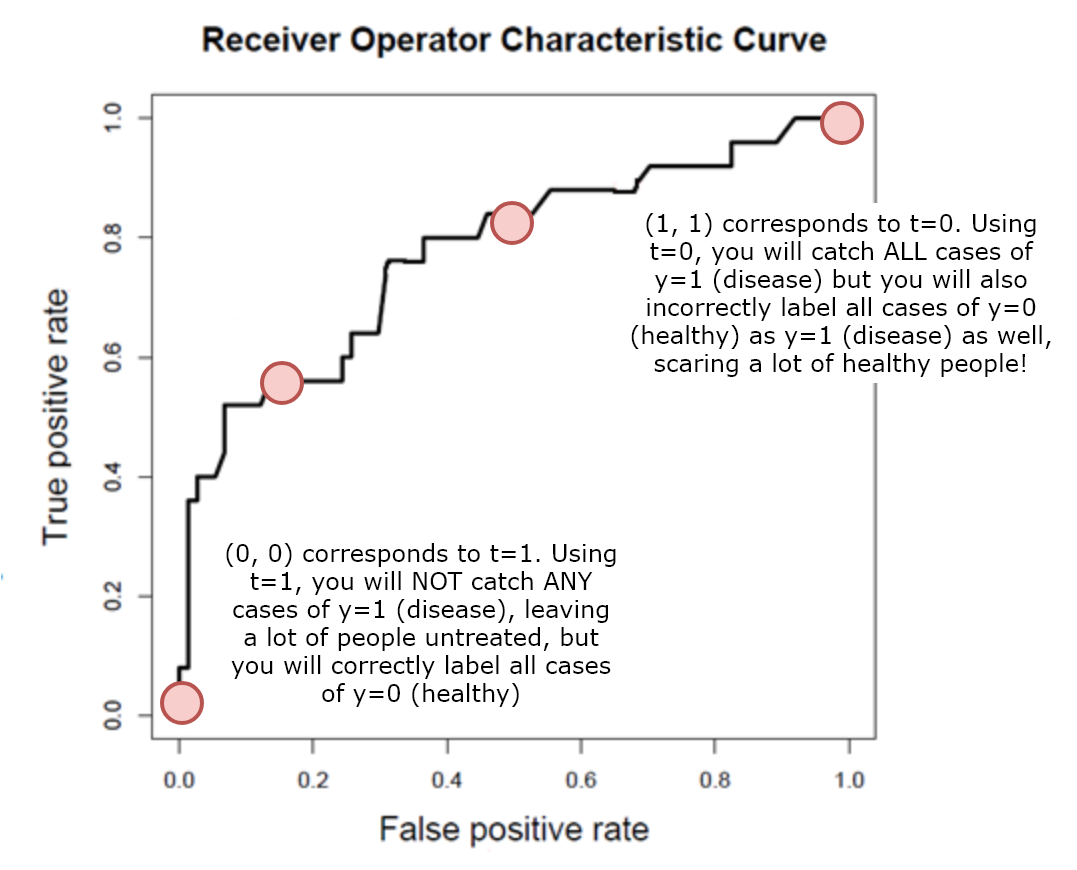
Figure 4.4: ROC curve
As illustrated in Figure 4.4, using a threshold value of 0 means that you will catch ALL cases of y=1 (disease), but you will also incorrectly label all cases of y=0 (healthy) as y=1 (disease) as well, scaring a lot of healthy people! However using a threshold value of ...

