To analyze the usage of the processing time, we will examine the call stack of our application. We will examine each of the functions invoked and how long it takes to complete their execution. We can access all this information by opening the Profiles tab in the Google Chrome developer tools:
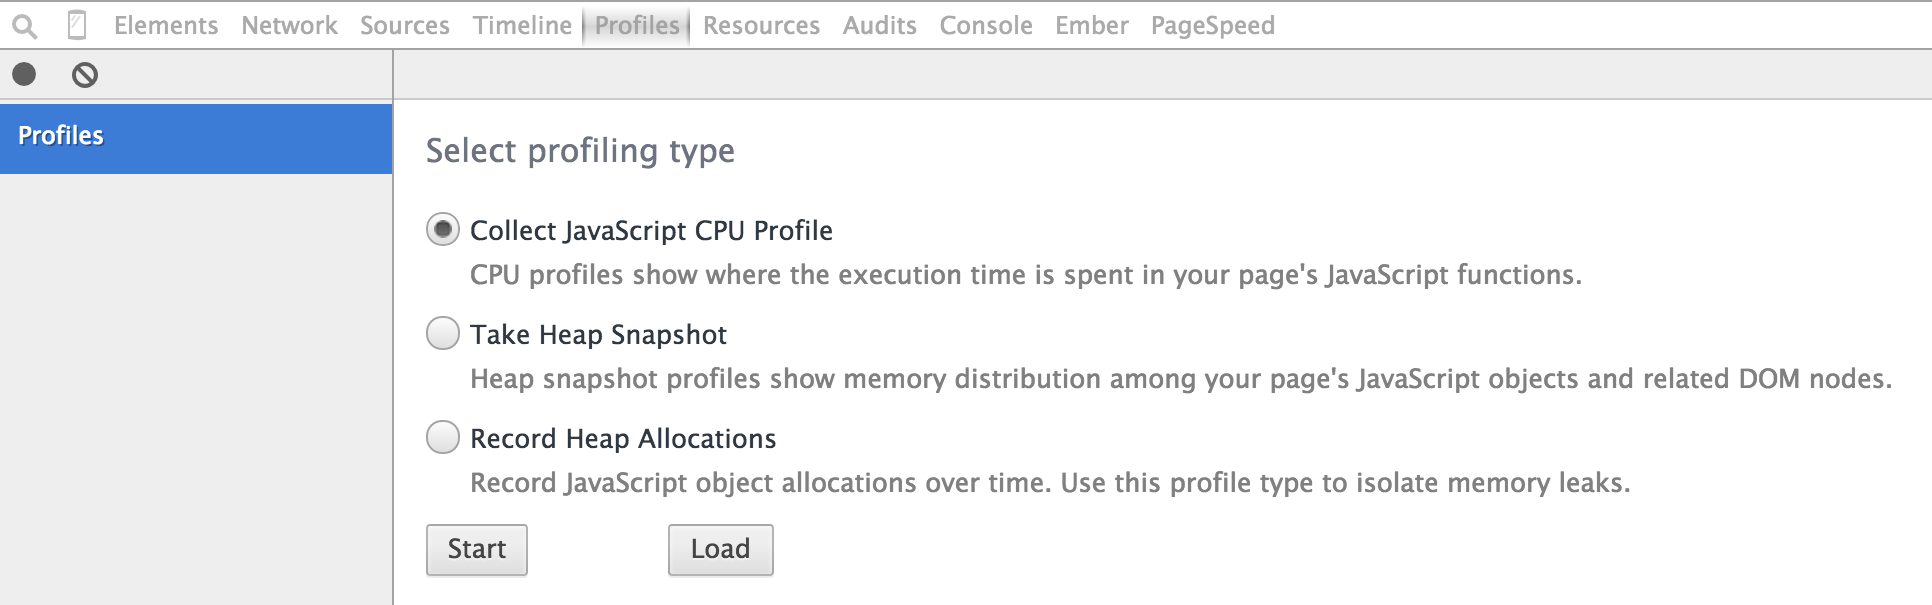
In this tab, we can select Collect JavaScript CPU Profile and then click on the Start button to start recording the CPU usage. Being able to select when we want to start and stop recording the CPU usage helps us select the specific functions that we want to analyze. If, for example, we want to analyze a function named foo, all ...

