Getting to know the SAP BO Dashboards interface
In this section, we will discuss the main interface panels, toolbars, and views. Let's have a look at the following screenshot, which describes the main interface areas in SAP BO Dashboards:
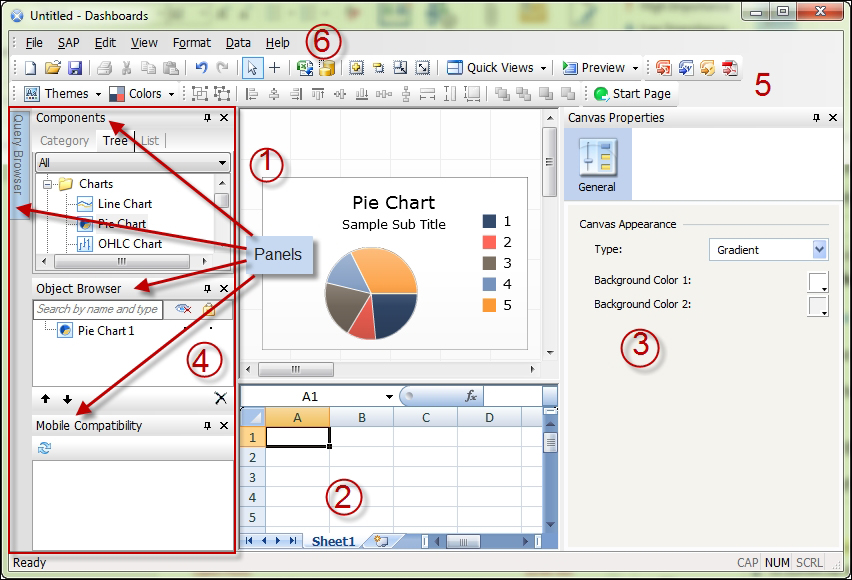
The main interface areas are:
- Canvas: We will use this area to place our dashboard components, such as charts, maps, and selectors.
- Excel model: We will use this embedded Excel model as a data container. Then, we will link our dashboard components to corresponding data cells in that Excel model. We can use this area exactly like a normal Excel file. We can add multiple sheets, use formulas, and use any Excel feature ...
Get Learning SAP BusinessObjects Dashboards now with the O’Reilly learning platform.
O’Reilly members experience books, live events, courses curated by job role, and more from O’Reilly and nearly 200 top publishers.

