Outlier detection
Outliers are very important to be taken into consideration for any analysis as they can make analysis biased. There are various ways to detect outliers in R and the most common one will be discussed in this section.
Boxplot
Let us construct a boxplot for the variable volume of the Sampledata, which can be done by executing the following code:
> boxplot(Sampledata$Volume, main="Volume", boxwex=0.1)
The graph is as follows:
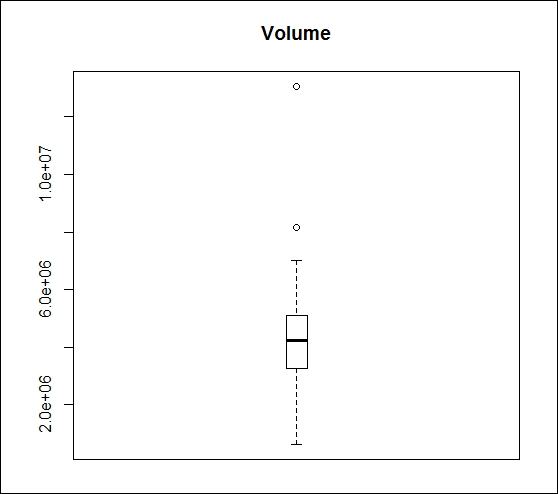
Figure 2.16: Boxplot for outlier detection
An outlier is an observation which is distant from the rest of the data. When reviewing the preceding boxplot, we can clearly see the outliers which are located outside ...
Get Learning Quantitative Finance with R now with the O’Reilly learning platform.
O’Reilly members experience books, live events, courses curated by job role, and more from O’Reilly and nearly 200 top publishers.

