Chapter 13. Histograms and Templates
In the course of analyzing images, objects, and video information, we frequently want to represent what we are looking at as a histogram. Histograms can be used to represent such diverse things as the color distribution of an object, an edge gradient template of an object [Freeman95], or the distribution of probabilities representing our current hypothesis about an object’s location. Figure 13-1 shows the use of histograms for rapid gesture recognition. Edge gradients were collected from “up,” “right,” “left,” “stop,” and “OK” hand gestures. A webcam was then set up to watch a person who used these gestures to control web videos. In each frame, color interest regions were detected from the incoming video; then edge gradient directions were computed around these interest regions, and these directions were collected into orientation bins within a histogram. The histograms were then matched against the gesture models to recognize the gesture. The vertical bars in Figure 13-1 show the match levels of the different gestures. The gray horizontal line represents the threshold for acceptance of the “winning” vertical bar corresponding to a gesture model.
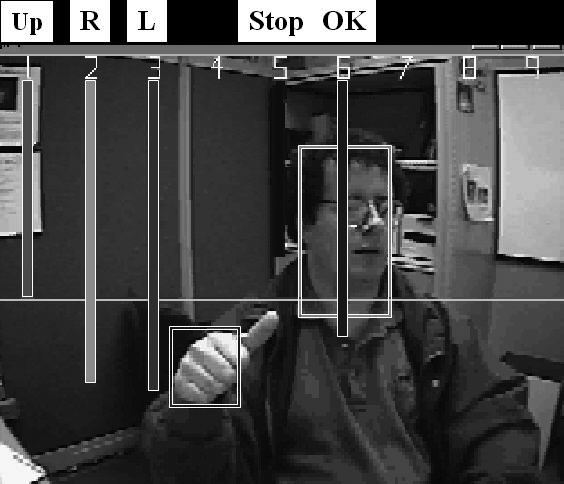
Figure 13-1. Local histograms of gradient orientations are used to find the hand and its gesture; here the “winning” gesture (longest vertical bar) is a correct recognition of “L” (move left)
Histograms ...
Get Learning OpenCV 3 now with the O’Reilly learning platform.
O’Reilly members experience books, live events, courses curated by job role, and more from O’Reilly and nearly 200 top publishers.

