Profiling with Visual Studio
Visual Studio has a great profiling tool integrated within its usual IDE.
The main menu root is ANALYZE. Here, we find all we need to understand an application's performance details, together with interesting static analysis tools to verify a programmer's skill.
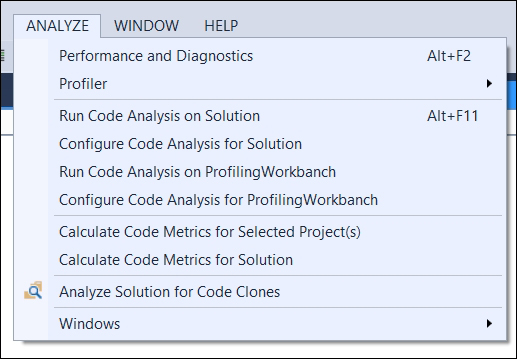
The ANALYZE menu as visible within Visual Studio 2013 update 4
Here's a brief guide to how to start profiling our application:
- Within the menu, click on the Performance and Diagnostics menu item. This link opens the main window to start profiling our applications. Using the performance wizard helps us in selecting the best profiling technique and configuration for ...
Get Learning .NET High-performance Programming now with the O’Reilly learning platform.
O’Reilly members experience books, live events, courses curated by job role, and more from O’Reilly and nearly 200 top publishers.

