When you load a program in x64dbg, you will be presented with a debugger display, as follows. The debugger display contains multiple tabs; each tab displays different windows. Each window contains different information regarding the debugged binary:
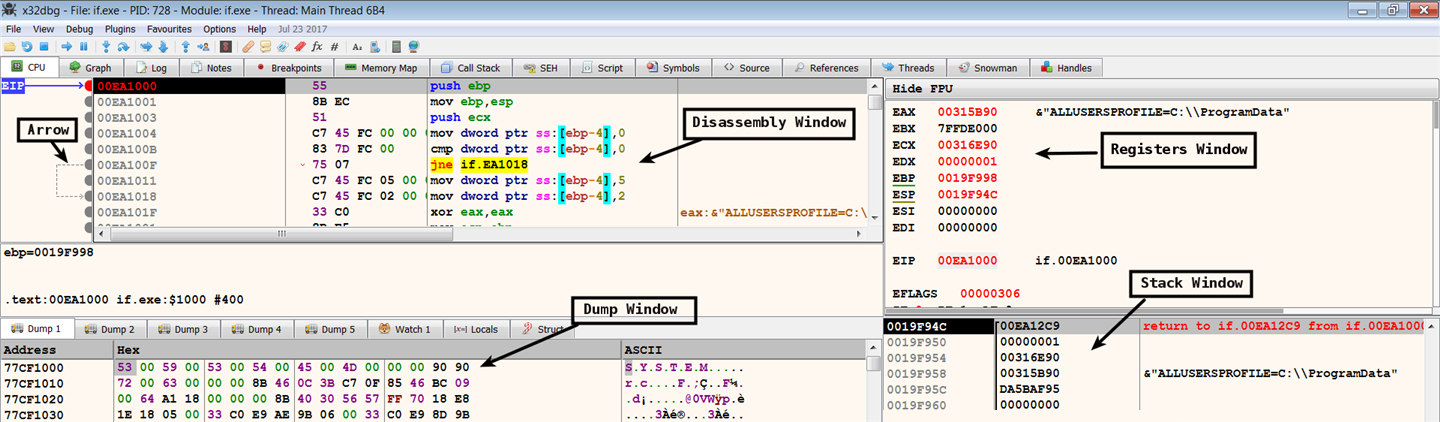
- Disassembly Window (CPU Window): This shows the disassembly of all of the instructions of the debugged program. This window presents the disassembly in a linear fashion, and it is synchronized with the current value of the instruction pointer register (eip or rip). The left portion of this window displays an arrow to indicate the program's non-linear flow (such as ...

