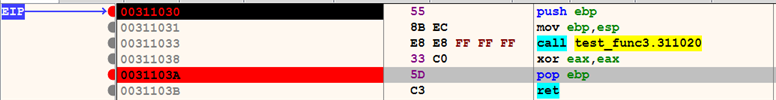
To demonstrate function tracing, consider the program shown in the following screenshot. In this program, the eip is pointing to the first instruction, the breakpoint is set at the fifth instruction (to stop tracing at this point), and the third instruction calls a function at 0x311020. We can use function tracing to determine what other functions are called by the function (0x311020):
To perform function tracing (Trace into was chosen in this case), the following setting is used. This is similar to instruction tracing, except that in the Log Condition field, an expression, telling the debugger to log only the function ...

