To debug JavaScript or ECMAScript code directly from VSCode, first, we need to install the Debugger for Chrome extension (https://goo.gl/QpXWGM).
Next, open the Web Server for Chrome extension and open the link to see the book examples in the browser (the default URL is http://127.0.0.1:8887/examples).
The following screenshot demonstrates how to debug directly from the editor:
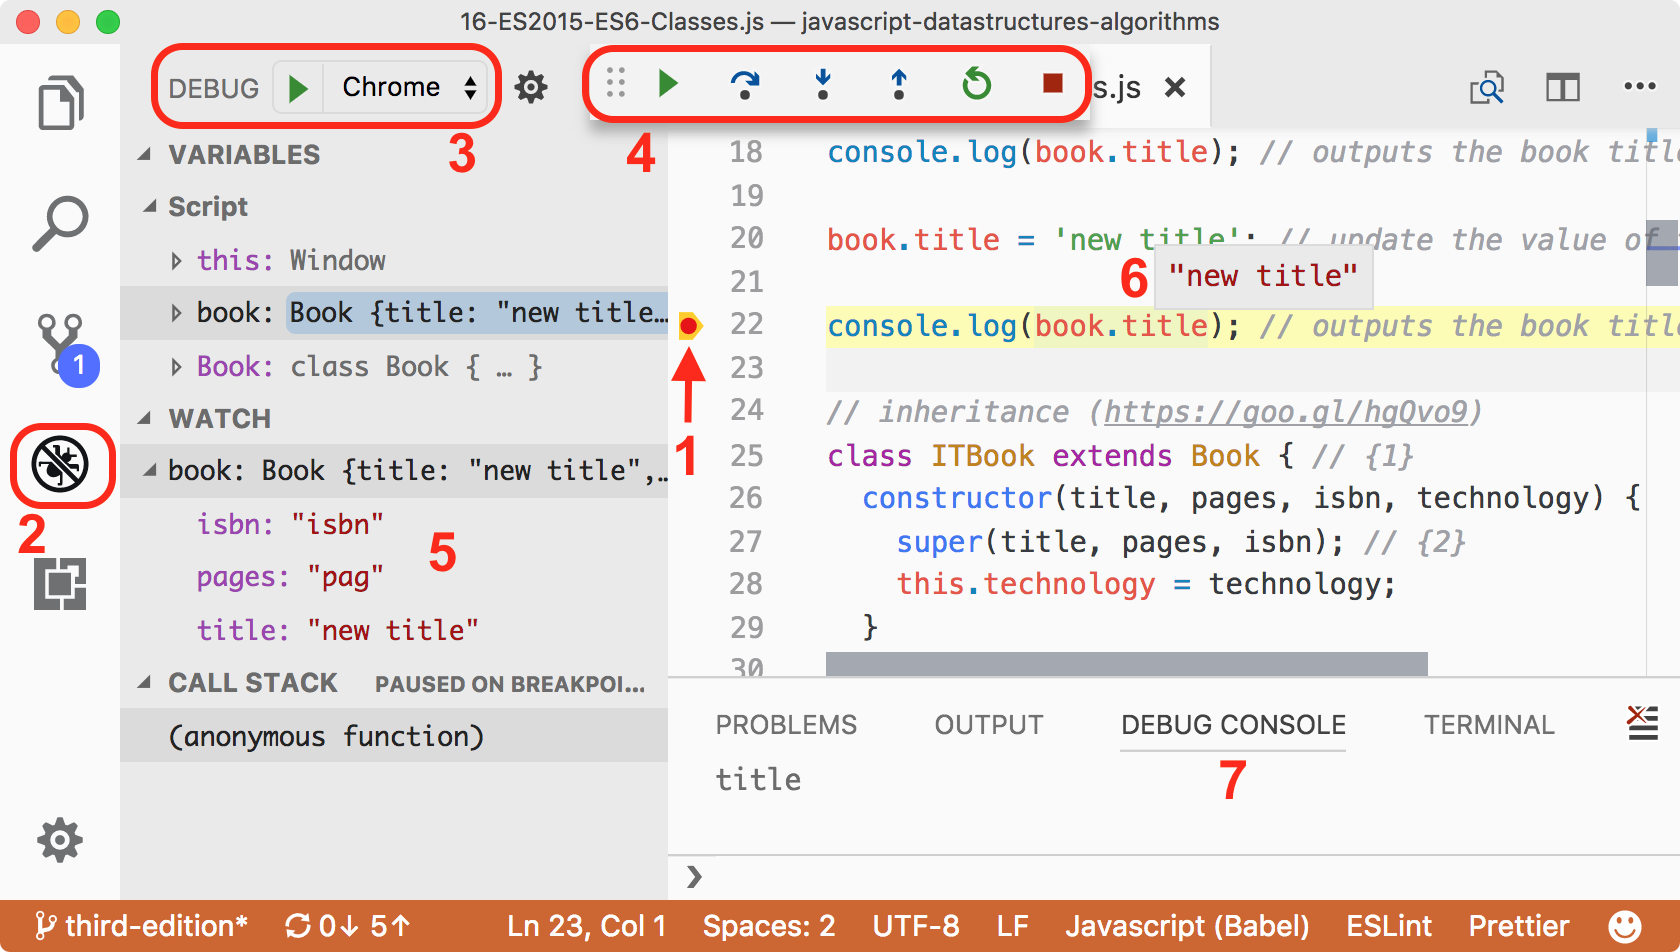
- In the editor, open the JavaScript file you want to debug, pass the mouse pointer near the line numbers, and click on the line to add a breakpoint (as demonstrated by 1 in the preceding screenshot). This is where the debugger will stop so we can ...

