Understanding debug FPS labels
Now, when we know that the frame rate is important, let's have a look once again at those debug labels that are displayed in the left bottom corner. Refer to the following screenshot:
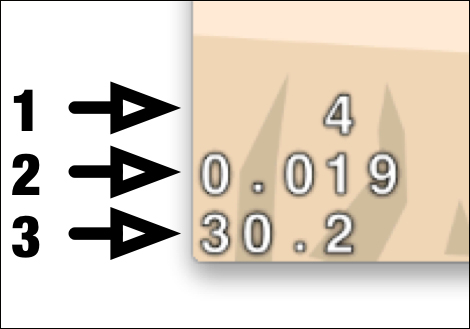
The following explains each numbered line shown in the preceding screenshot:
- The number of OpenGL draw calls per frame: Each call to the OpenGL draw function has a performance cost. We have four objects in our scene: background, bird, hunter's torso, and his legs. This gives us four OpenGL draw calls. If you add one more bird to the scene, this number will increase to five and so on. Soon, I will show you how to draw several objects in ...
Get Learning iPhone Game Development with Cocos2D 3.0 now with the O’Reilly learning platform.
O’Reilly members experience books, live events, courses curated by job role, and more from O’Reilly and nearly 200 top publishers.

