Experimenting with dataClasses and nullColor options in a heatmap
An alternative way to define the color axis is to have a specific range of values associated with a color. Let's plot another heatmap chart. In this example, we reconstruct a graph taken from http://kindofnormal.com/truthfacts, shown here:
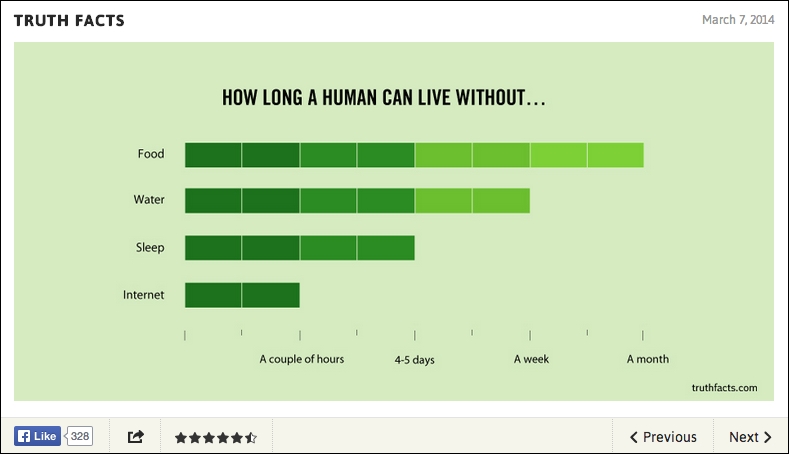
To recreate the preceding chart, we first use an inverted heatmap to emulate it as a bar chart, but the bars itself are composed of cells with a gradual change of color. We treat each block as a unit of y axis value and every two intervals associates with a color value. Hence, the range along the y-axis is between 0 and 8. Here is the trimmed configuration: ...
Get Learning Highcharts 4 now with the O’Reilly learning platform.
O’Reilly members experience books, live events, courses curated by job role, and more from O’Reilly and nearly 200 top publishers.

