Plotting a commercial pyramid chart
A pyramid chart is the inverse of a funnel chart, but in a pyramid shape, generally used for representing a top-down hierarchical ordering of data. Since this is a part of the funnel chart module, funnel.js is required.
The default order for data entries is that the last entry in the series data array is shown at the top of the pyramid. This can be corrected by switching the reverse option to false. Let's take a real-life example for this exercise. The following is a picture of the Global Wealth Pyramid chart taken from the Credit Suisse Global Wealth Databook 2013:
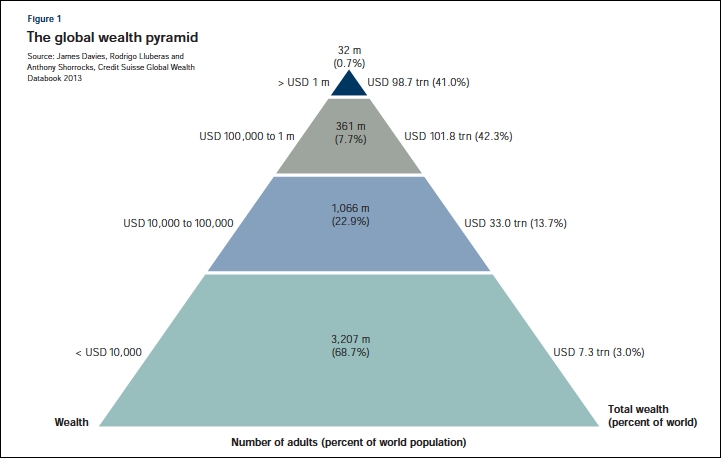
As we can see, it looks stylish with data labels ...
Get Learning Highcharts 4 now with the O’Reilly learning platform.
O’Reilly members experience books, live events, courses curated by job role, and more from O’Reilly and nearly 200 top publishers.

