Sketching an area chart
In this section, we are going to use our very first example and turn it into a more stylish graph (based on the design of a wind energy poster by Kristin Clute): an area spline chart. An area spline chart is generated using the combined properties of area and spline charts. The main data line is plotted as a spline curve and the region underneath the line is filled in a similar color with a gradient and opaque style:
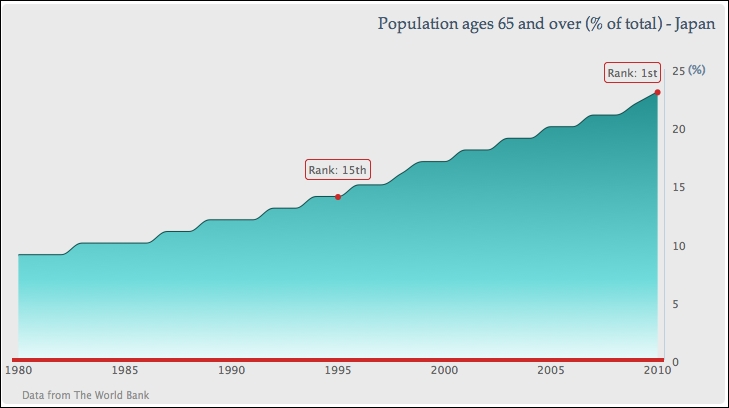
First, we want to make the graph easier for viewers to look up the values for the current trend, so we move the y-axis values to the right side of the chart, where they will be closest to the most recent year: ...
Get Learning Highcharts 4 now with the O’Reilly learning platform.
O’Reilly members experience books, live events, courses curated by job role, and more from O’Reilly and nearly 200 top publishers.

