Chapter 2. Graph Theory
The alarm sounds. You reach for your phone. When you turn off the beeping, you see two notifications. Fifteen people liked a tweet that you wrote last night. Nice. Three people retweeted it. Double nice. Your momentary Twitter notoriety was brought to you by a graph (as seen in Figure 2-1).
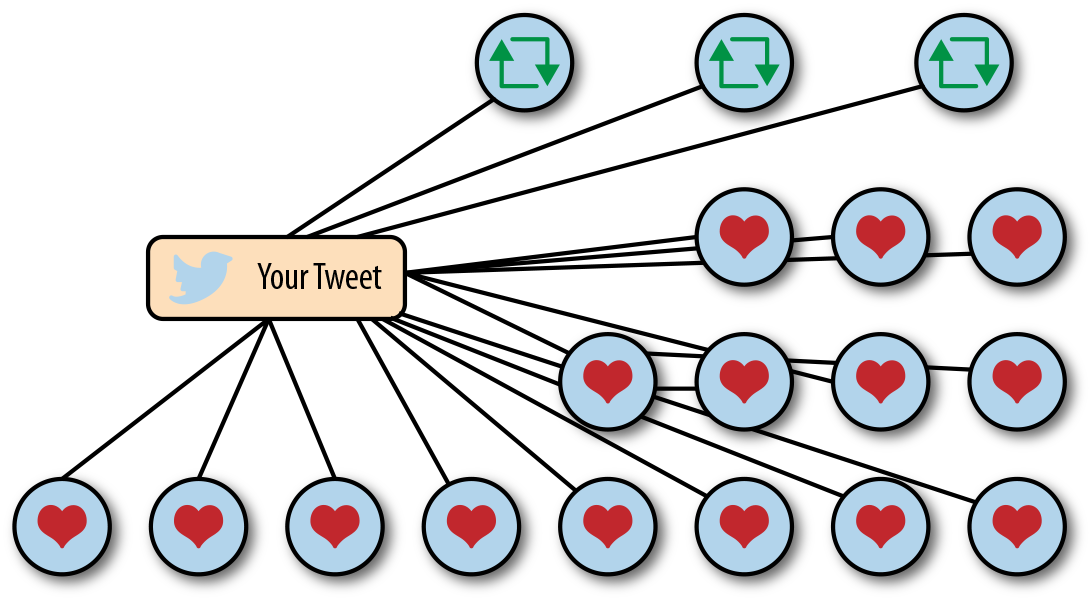
Figure 2-1. Twitter likes and retweets diagram
You’re running up the stairs to catch the “L” at Irving Park. You jump in right before the doors close. Perfect. The train shakes side to side as you move forward, connecting every stop.
The doors open and close at each station. First, Addison. Then, Paulina, Southport, and Belmont. At Belmont, you cross the platform to transfer to the Red Line. On the Red Line, you make two more stops: Fullerton and North/Clybourn. This graph brought you to work, as shown in Figure 2-2.
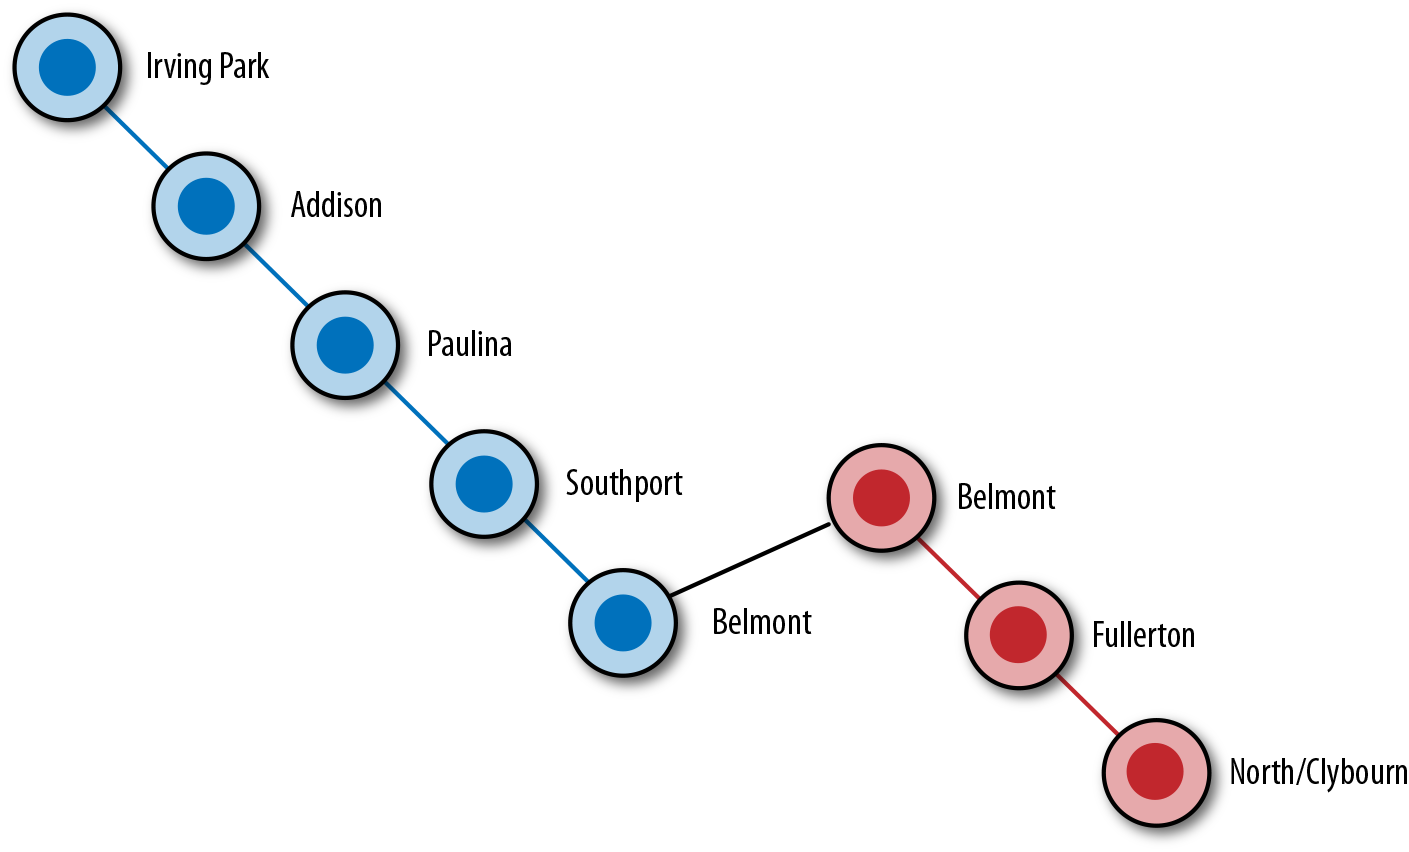
Figure 2-2. Chicago “L” map
You’re riding the escalator up to street level when your phone rings. It’s your sister. She says that she wants to buy train tickets to go to your Grandpa’s 80th birthday party in July. “Mom’s dad or Dad’s dad?” you ask. “Dad’s, but I think Mom’s parents will be there, too. And Aunt Linda and Uncle Steve.” You begin to picture who will be there. Another party planned by another graph: a family tree. Figure 2-3 shows this graph. ...
Get Learning GraphQL now with the O’Reilly learning platform.
O’Reilly members experience books, live events, courses curated by job role, and more from O’Reilly and nearly 200 top publishers.

