Visualizing with Kibana
Now that you have verified that your data is indexed successfully in Elasticsearch, we can go ahead and look at the Kibana interface to get some useful analytics from the data.
Running Kibana
As described in Chapter 1, Introduction to ELK Stack, we will start the Kibana service from the Kibana installation directory:
$ bin/kibana
Now, let's see Kibana up and running with a screen similar to the following screenshot on the browser with this URL:
http://localhost:5601
We can verify our index and fields in the Settings page under the indices tab as follows:
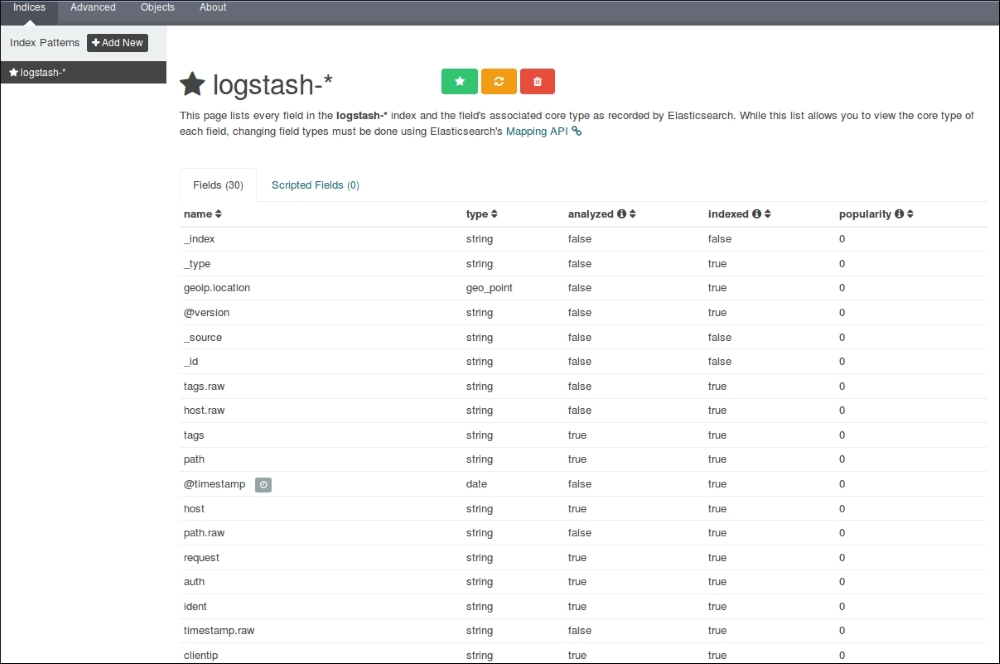
Kibana Settings page
It shows all our fields that were indexed, their data ...
Get Learning ELK Stack now with the O’Reilly learning platform.
O’Reilly members experience books, live events, courses curated by job role, and more from O’Reilly and nearly 200 top publishers.

