Visualizing with Kibana
Now when you verify that your data is indexed successfully in Elasticsearch, we can go ahead and look at the Kibana interface to get some useful analytics from the data.
Running Kibana
As described in the previous chapter, we will start the Kibana service from the Kibana installation directory.
$ bin/kibana
Now, let's see Kibana up and running similar to the following screenshot on the browser, by going to the following URL:
http://localhost:5601
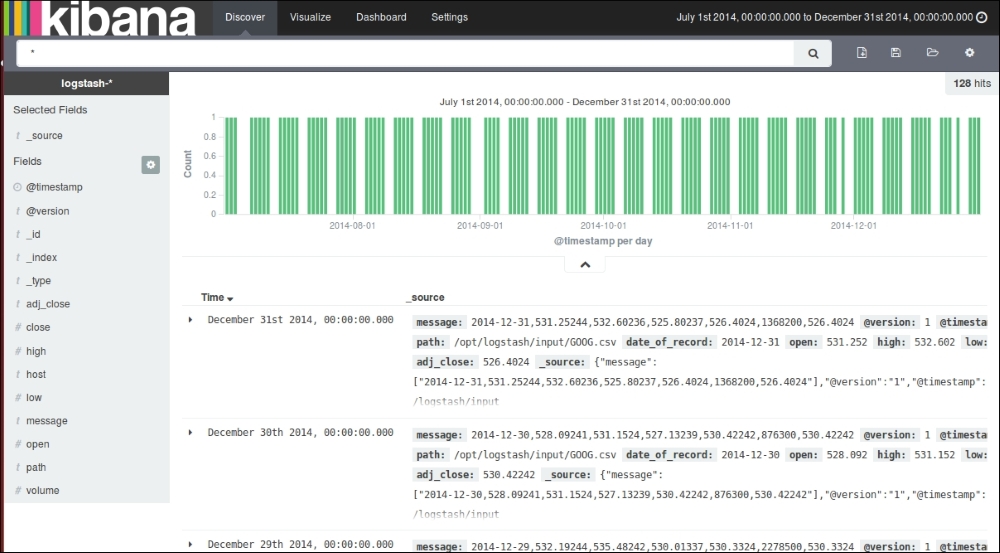
Kibana Discover page
As we already set up Kibana to take logstash-* indexes by default, it displays the indexed data as a histogram of counts, and the associated data as fields in the ...
Get Learning ELK Stack now with the O’Reilly learning platform.
O’Reilly members experience books, live events, courses curated by job role, and more from O’Reilly and nearly 200 top publishers.

