The Call Stack
As you step in and out of methods, the Call Stack window keeps track of the order and hierarchy of method calls. Figure 9-15 shows a close-up picture of the Call Stack window. You can see that the Box constructor was called by the Run( ) method, while the Run( ) method was in turn called by Main( ).
In this case, if you double-click on the second line in the Call Stack window, the debugger shows you the line in Run( ) that called the Box constructor, as shown in Figure 9-16. Notice that the debugger puts a green curved arrow on the line in the call stack you’ve double-clicked on, and a matching arrow in the editor to the line that corresponds to that call. This way, if you’re debugging a method and you think the data causing the problem came from outside the method, you can quickly find where the method call came from and check the values at that point.
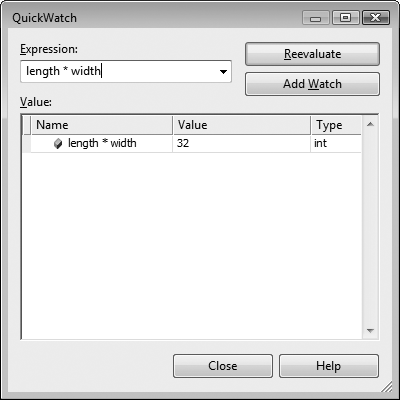
Figure 9-14. The QuickWatch recalculation feature lets you test out various adjustments to a variable without rewriting your code.
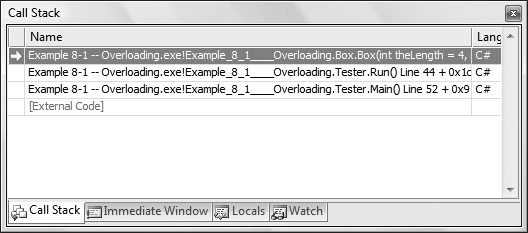
Figure 9-15. The Call Stack window keeps track of the various method calls in your program, no matter how deep you nest them.
Get Learning C# 3.0 now with the O’Reilly learning platform.
O’Reilly members experience books, live events, courses curated by job role, and more from O’Reilly and nearly 200 top publishers.

