Using Color Scales
Color scales are a handy way of showing how the values in a set of cells compare to each other by setting the background color of each cell to represent its value. Excel lets you use either two-color scales or three-color scales. For example, to illustrate a range of temperatures, you could use a two-color scale with blue for the low temperatures and red for the high temperatures, or a three-color scale with blue representing an uncomfortably low temperature, green comfortable, and red uncomfortably warm. Figure 8–7 shows an example of this kind of daily temperature chart for the first half of a year.
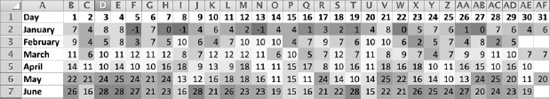
Figure 8–7. You can ...
Get Learn Excel 2011 for Mac now with the O’Reilly learning platform.
O’Reilly members experience books, live events, courses curated by job role, and more from O’Reilly and nearly 200 top publishers.

