TABLES AND CHARTS
36. Think of the Chart as a Whole
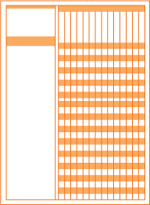
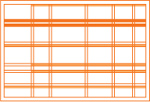
Creating charts, tables, and timetables is an intimidating feat dictated by numerical information. In her book, Thinking with Type, Ellen Lupton advises designers to avoid the type crime of creating what she calls a data prison, with too many rules and boxes. Following Lupton’s advice, think of the chart, grid, or timetable as a whole and consider how each column, row, or field relates to the entire scheme.
Use shades of a color to help the user navigate through dense information. Shades work ...
Get Layout Essentials now with the O’Reilly learning platform.
O’Reilly members experience books, live events, courses curated by job role, and more from O’Reilly and nearly 200 top publishers.

