Visual guide for the views
In this section, we will introduce the iris dataset (Frank, A. & Asuncion, A. (2010). UCI Machine Learning Repository (http://archive.ics.uci.edu/ml). Irvine, CA: University of California, School of Information and Computer Science. Iris dataset: http://archive.ics.uci.edu/ml/datasets/Iris) with some screenshots from the views (without their controls).
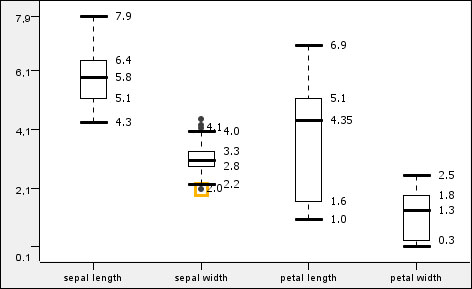
Box plot for the numeric columns
The Conditional Box Plot and the Box Plot nodes' views look similar. These are also sometimes called box-and-whisker diagrams. The Box Plot node visualizes the values of different columns, while the Conditional Box Plot view shows one column's ...
Get KNIME Essentials now with the O’Reilly learning platform.
O’Reilly members experience books, live events, courses curated by job role, and more from O’Reilly and nearly 200 top publishers.

