Cumulative flow diagram
A common graph used together with Kanban is the cumulative flow diagram. It looks like what is shown in the following diagram:
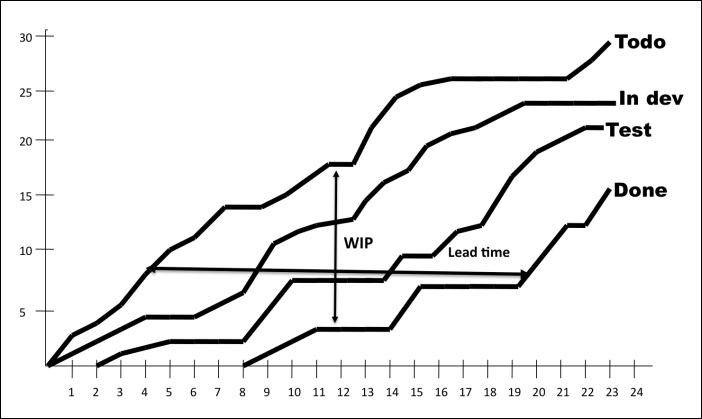
A cumulative flow diagram shows the number of items in each column
The diagram shows the accumulated number of issues in a flow with the four statuses: Todo, In dev, Test, and Done. After one day there are 3 issues on the board, 2 in Todo, and 1 in In dev. On day 9 there is 1 issue Done. That means we have spent 8 days to complete it, which means that is we have a lead-time of 8 days. At the same day there are 13 not done things on the board. The Todo line is on 14 and 1 thing is in Done. This means ...
Get Kanban In 30 days now with the O’Reilly learning platform.
O’Reilly members experience books, live events, courses curated by job role, and more from O’Reilly and nearly 200 top publishers.

