Burn-up graph
The close cousin to the burn down graph is the burn up graph. While the burn down graph shows how much there is left, the burn up graph shows how much that has been done. This is even more flexible and easy to start with since you don't need to estimate the whole project from the beginning. You still need to estimate the work before you start working with just that part. The alternative of estimating after it´s done will just be a predictable graph showing the time spent on the project so that is nothing we recommend. If your items are of a similar size there is no need for estimating, just counting is enough.
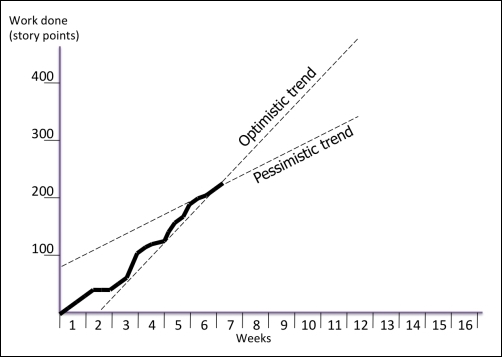
A burn up graph showing ...
Get Kanban In 30 days now with the O’Reilly learning platform.
O’Reilly members experience books, live events, courses curated by job role, and more from O’Reilly and nearly 200 top publishers.

