Simulating the result
If you know how to program or if you are an advanced user of Excel (or any other spreadsheet program for that matter), you can simulate the result instead of testing it. In the following graph, you can see the result of a simulation where 5 players are running 100 rounds and where the limit was changed between 3 and 100:
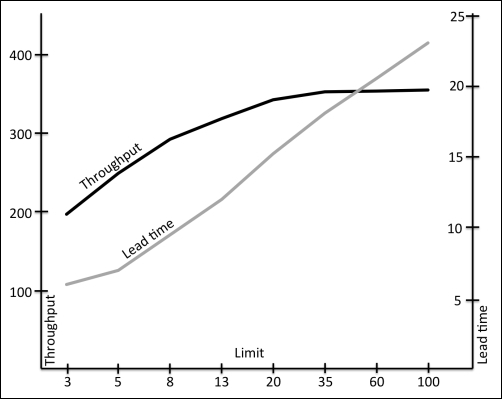
The graph shows the result of a data simulation
The interesting result is shown in the following table:
|
Changing limit |
Difference in throughput |
Difference in time to market |
|---|---|---|
|
100 to 5 |
-31% |
-70% |
|
100 to 8 |
-19% |
-59% |
|
100 to 13 |
-12% |
-48% |
|
100 to 20 |
-5% |
-34% |
This means that if you set the limit to ...
Get Kanban In 30 days now with the O’Reilly learning platform.
O’Reilly members experience books, live events, courses curated by job role, and more from O’Reilly and nearly 200 top publishers.

