Chapter 5. System Services
To best leverage the SRX platforms, you need to have a solid understanding of both the security concepts and components, but also of the platform itself. Junos provides a very rich set of features when it comes to system services. Properly configuring and operating the system services is often overlooked during the initial setup of the system. Although most of these topics are the same as other Junos platforms, such as the EX/M/MX/T Series, there are some different implications with the SRX because it is a security device, and some of the security and hardware components rely on these differently. In this chapter, we examine the various system services that you should be aware of on the platform and how to properly leverage them to get the best operational state.
System Services Operation on the SRX
Before we delve into how to configure the individual components in the Junos system services family, we will first have a quick discussion of how the system services operate in the SRX itself so that you have a good understanding of how the system functions operationally. With the proper background, you will have the tools you need to effectively configure and operate the SRX.
Figure 5-1 shows a high-level view of where system services live on the SRX. This is true for both the branch and the high-end SRX because there is a true separation of the control and data plane—even if it is just processor/memory separation on the branch SRX.
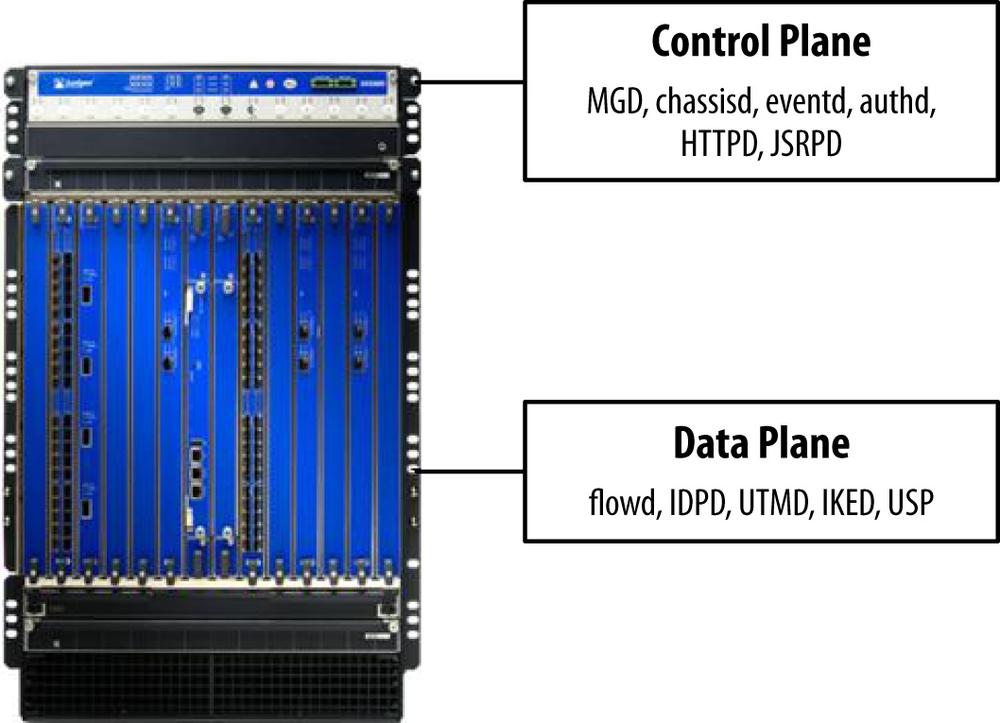
System Services and the Control Plane
The control plane is responsible for operating most of the system services on the SRX. That is in large part due to the intended function of the control plane, which is to control the platform—rather than operating on the transit traffic itself. The control plane is responsible not only for acting as the interface for which you, the administrator, operate the device, but also for controlling the operation of the chassis, pushing the configuration to the data plane, and operating the daemons that provide functionality to the system. As you already know, the control plane operates the Junos OS, which is a FreeBSD variant. The OS only provides the very basic functionality that an OS provides. This includes process management, scheduling, resource control, and abstracting the hardware so that an array of software can operate on it. This software includes the daemons that provide the system services. Some of them you directly interface with, like MGD (our management daemon), whereas others operate behind the scenes and provide passive functions to the administrator. The good news is that from a configuration perspective, you, the administrator, do not have to be particularly concerned with the OS functions or the individual daemons themselves, Junos handles all of this for you. Instead, you influence the operation of these components based on how you configure the Junos configuration itself; Junos takes it from there.
There are several reasons why most system services operate from the control plane and not the data plane; the control plane is designed to provide a much richer set of features than the data plane. The data plane is intended simply to process traffic. It must be lean, and often it is completely distributed (e.g., on the SRX/M/MX/T/EX and others). The control plane has a bird’s-eye view of the entire chassis and can act as the control point for underlying operations that must be performed on the data plane (e.g., pushing down routes to the forwarding table on all processors on the data plane).
Although the control plane can be thought of as the brains of the operation, processing input and pushing it down to all of the nodes on the data plane, as shown in Figure 5-2, the data plane itself must also have a mechanism to receive this data and act on it.
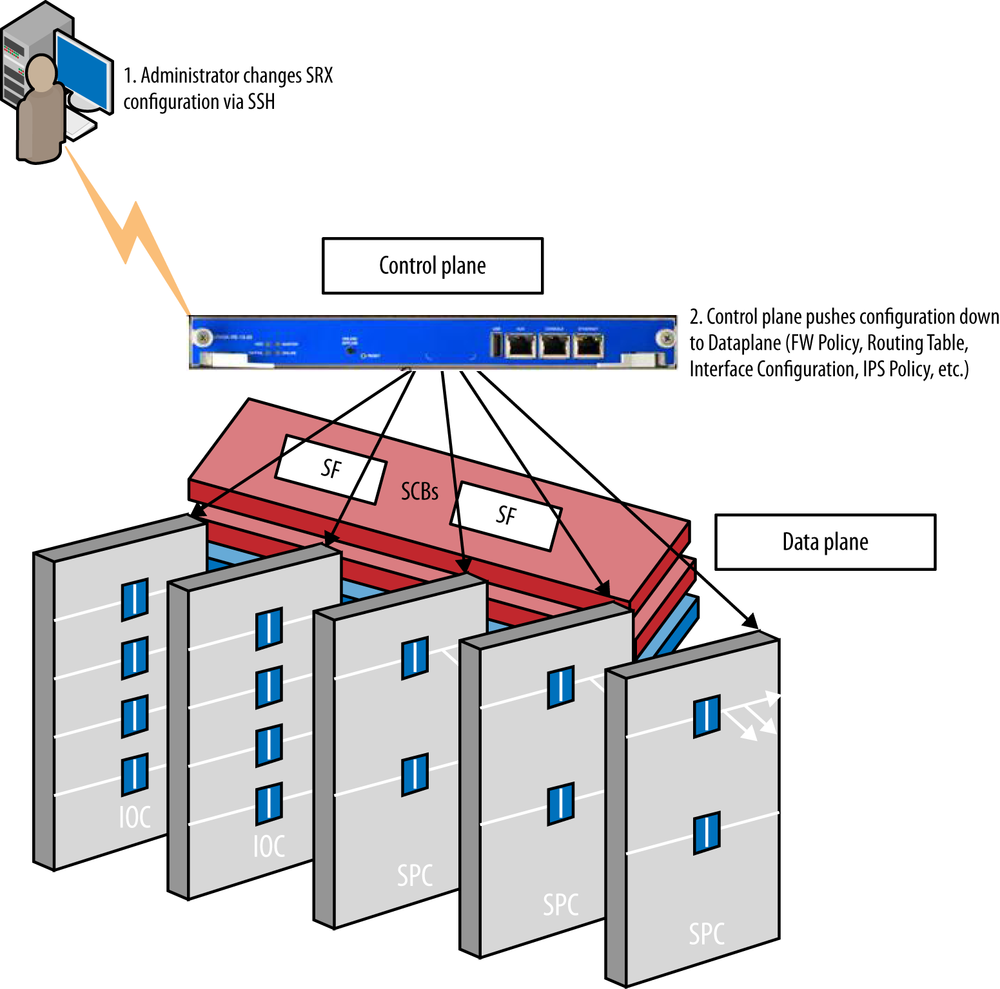
Some system services do operate from the data plane, but typically they are specifically designed to operate functions on the data plane itself for maximum performance (e.g., Logging/JFlow as we’ll see shortly).
System services that operate on the control plane
So we’ve alluded to the fact that most system services operate from the control plane, but we haven’t specified which ones. It isn’t necessary to understand where the services live to operate the platform, but it is certainly helpful to understand this concept.
- Management Daemon (MGD)
Provides the interface between the UI components and the backend configuration and is responsible for acting on the Junos configuration to the system itself.
- Routing Protocol Daemon (RPD)
All routing protocols including RIP, OSPF, IS-IS, BGP, PIM, IPv6 counterparts, and so on.
- User interfaces
Console, Telnet, SSH, J-Web, NetConf.
- Filesystem interfaces
FTP/SCP.
- Syslogd
Logging subsystem on the control plane, different than what is on the data plane. This generates the OS and application logs on the control plane.
- Networking services
DNS, DHCP, NTP, ICMP, ARP/ND, SNMP.
- Chassisd
Controls the hardware operations of the data plane and interfaces with the components to ensure they are active and operating properly.
- JSRPD
This is the high availability daemon that runs the HA functionality between two SRX chassis in an HA cluster.
System Services and the Data Plane
We’d be remiss to say that there are no system services that function on the data plane—although truth be told, you are not likely to deal with them. Of course, there’s little that you need to interface with on the control plane, more of just an understanding that they exist. On the data plane, the system services provide a different function, which is to directly act on traffic that is transiting the device. For instance, there is an Intrusion Detection and Prevention Daemon (IDPD) process that runs the IPS daemon on the control plane, but there it is responsible for signature downloads, policy compilation, pushing the policy to the data plane, and operational activities such as retrieving information from user-triggered commands, configuration changes, and automated system processes. IDPD also exists on the data plane (particularly in certain deployment modes like dedicated/inline tap modes) where it is responsible for not only interfacing with the IDPD process on the control plane to accept new configurations and provide statistics, but for directly processing the IPS-bound traffic itself. These two daemons are effectively different in function, acting as counterparts but sharing the same name.
IDPD was just one example; there are similar examples for IKED, PKID, and many other subsystems. The key is that control and data plane separation. The daemons running on the control plane operate to control the platform and provide operational instructions to the daemons running on the data plane, which operate directly on the traffic. Of course, there isn’t strictly a 1:1 relation between control plane and data plane daemons, as lots of control plane subsystems cooperate with flowd on the data plane, which is the main data plane daemon, for instance.
Accounts for Administrative Users
Junos has a very robust infrastructure for administrative users on the SRX and other Junos devices. Not only does it support full local and remote authentication, but it also has perhaps the best role-based access control system in the industry. Junos has the ability not only to define read-only/read-write capabilities for the system, but you can actually restrict this down to configuration or operational stanzas and even down to the command level. Covering the complete set of capabilities for user authentication and RBAC in Junos is outside the scope of this book, but it is covered in other O’Reilly books like JUNOS Cookbook by Aviva Garrett (O’Reilly).
Configuring local users
Junos has two types of users: local and remote. For local users, you must define the user properties along with the login class information. The login class specifies what access they have on the device itself. There are several predefined classes, or you can create your own as we will do in the next example. In this example, we’ll create the user Bob who is an operator and configure a plain-text password abc123.
root# set system login user Bob class ?
Possible completions:
  <class>              Login class
  operator             permissions [ clear network reset trace view ]
  read-only            permissions [ view ]
  super-user           permissions [ all ]
  unauthorized         permissions [ none ]

root# set system login user Bob class operator authentication ?
Possible completions:
+ apply-groups         Groups from which to inherit configuration data
+ apply-groups-except  Don't inherit configuration data from these groups
  encrypted-password   Encrypted password string
  load-key-file        File (URL) containing one or more ssh keys
  plain-text-password  Prompt for plain text password (autoencrypted)
> ssh-dsa              Secure shell (ssh) DSA public key string
> ssh-rsa              Secure shell (ssh) RSA public key string

 [edit]
root# set system login user Bob class operator authentication plain-text-password
New password:
Retype new password:

[edit]
root# show system login user Bob
class operator;
authentication {
    encrypted-password "$1$uLe/a9L4$tXkURwP1Z0YRwoQJA7Sfb/"; ## SECRET-DATA
}
As you can see from this example, there are four predefined classes, with the permissions listed to the right. In terms of local user authentication, you can use a password, an SSH key, or RSA/DSA SSH key, which is loaded by the terminal rather than by file. The encrypted password is useful if you’re transferring a password from another system and don’t know the real password but are loading it from the configuration.
Creating a login class
Login classes give you maximum control over permissions on the system for your administrators. You have complete control for what commands can be issued at an operational level as well as what can be viewed or configured within the configuration itself. You can explicitly define complete commands, but Junos also allows you to define them from a stanza perspective so you do not need to configure the complete commands to block everything underneath them.
In this example, we’ll make a new class called Security Admin that will only allow users to use show and clear operational mode commands and only configure objects under “set security” and “set services” in the configuration, but it will allow them to view the entire configuration.
[edit]
root# set system login class "Security Admin" ?
Possible completions:
  access-end           End time for remote access (hh:mm)
  access-start         Start time for remote access (hh:mm)
  allow-commands       Regular expression for commands to allow explicitly
  allow-configuration  Regular expression for configure to allow explicitly
+ allow-configuration-regexps  Object path regular expressions to allow
+ allowed-days         Day(s) of week when access is allowed.
+ apply-groups         Groups from which to inherit configuration data
+ apply-groups-except  Don't inherit configuration data from these groups
  deny-commands        Regular expression for commands to deny explicitly
  deny-configuration   Regular expression for configure to deny explicitly
+ deny-configuration-regexps  Object path regular expressions to deny
  idle-timeout         Maximum idle time before logout (minutes)
  logical-system       Logical system associated with login
  login-alarms         Display system alarms when logging in
  login-script         Execute this login-script when logging in
  login-tip            Display tip when logging in
+ permissions          Set of permitted operation categories
  security-role        Common Criteria security role


[edit]
root# set system login class Security-Admin allow-commands "show|clear|configure"

[edit]
root# set system login class Security-Admin ?
Possible completions:
  access-end           End time for remote access (hh:mm)
  access-start         Start time for remote access (hh:mm)
  allow-commands       Regular expression for commands to allow explicitly
  allow-configuration  Regular expression for configure to allow explicitly
+ allow-configuration-regexps  Object path regular expressions to allow
+ allowed-days         Day(s) of week when access is allowed.
+ apply-groups         Groups from which to inherit configuration data
+ apply-groups-except  Don't inherit configuration data from these groups
  deny-commands        Regular expression for commands to deny explicitly
  deny-configuration   Regular expression for configure to deny explicitly
+ deny-configuration-regexps  Object path regular expressions to deny
  idle-timeout         Maximum idle time before logout (minutes)
  logical-system       Logical system associated with login
  login-alarms         Display system alarms when logging in
  login-script         Execute this login-script when logging in
  login-tip            Display tip when logging in
+ permissions          Set of permitted operation categories
  security-role        Common Criteria security role

 [edit]
root# set system login class Security-Admin allow-configuration "security|services"

[edit]
root# show system login class Security-Admin
allow-commands "show|clear|configure";
allow-configuration "security|services";
You can also opt to define what permissions you would like to assign rather than defining explicit regular expressions for operational/configuration mode with the Permissions fields.
[edit]
root# set system login class Security-Admin2 permissions ?
Possible completions:
  [                    Open a set of values
  access               Can view access configuration
  access-control       Can modify access configuration
  admin                Can view user accounts
  admin-control        Can modify user accounts
  all                  All permission bits turned on
  clear                Can clear learned network info
  configure            Can enter configuration mode
  control              Can modify any config
  field                Can use field debug commands
  firewall             Can view firewall configuration
  firewall-control     Can modify firewall configuration
  floppy               Can read and write the floppy
  flow-tap             Can view flow-tap configuration
  flow-tap-control     Can modify flow-tap configuration
  flow-tap-operation   Can tap flows
  idp-profiler-operation  Can Profiler data
  interface            Can view interface configuration
  interface-control    Can modify interface configuration
  maintenance          Can become the super-user
  network              Can access the network
  pgcp-session-mirroring  Can view pgcp session mirroring configuration
  pgcp-session-mirroring-control  Can modify pgcp session mirroring configuration
  reset                Can reset/restart interfaces and daemons
  rollback             Can rollback to previous configurations
  routing              Can view routing configuration
  routing-control      Can modify routing configuration
  secret               Can view secret statements
  secret-control       Can modify secret statements
  security             Can view security configuration
  security-control     Can modify security configuration
  shell                Can start a local shell
  snmp                 Can view SNMP configuration
  snmp-control         Can modify SNMP configuration
  storage              Can view fibre channel storage protocol configuration
  storage-control      Can modify fibre channel storage protocol configuration
  system               Can view system configuration
  system-control       Can modify system configuration
  trace                Can view trace file settings
  trace-control        Can modify trace file settings
  view                 Can view current values and statistics
  view-configuration   Can view all configuration (not including secrets)
That description information is quite self-explanatory. A base
option like “security” allows you to view the configuration, where the
<option> control allows you to edit it as
well.
Remote authentication
Junos supports remote authentication like RADIUS and Tacacs+ for administrative authentication. These days, RADIUS is a popular choice because most authentication systems that include two-factor authentication support it. Junos also allows you to gather the permissions and capabilities from the authentication system itself.
In this example, we configure a RADIUS Server at 192.168.1.250 with a port 1812 and a secret OnceUponAT1m3. We will try to authenticate users with RADIUS first, then a password if that fails. All users authenticated by RADIUS will have class super-user.
[edit]
root# set system radius-server 192.168.1.250 port 1812 secret OnceUponAT1m3

[edit]
root# set system authentication-order [radius password]

[edit]
root# set system login user remote class super-user

[edit]
root# set system login user Jim class operator


[edit]
root# show system radius-server
192.168.1.250 {
    port 1812;
    secret "$9$a0UH.AtOREyP5hyrlXxZUjkPQF3/pOIF3IcleW8"; ## SECRET-DATA
}

root# show system authentication-order
authentication-order [ radius password ];


[edit]
root# show system login user remote
class super-user;

[edit]
root# show system login user Jim
class operator;
Looking over the previous example, there are a few things to note. Mainly that there is a special user called “remote.” This user is automatically authenticated by the external system and derives its class accordingly. You can define users manually to give them a special class (like Jim, who will be an operator). Because there is no password or other authentication defined, they cannot be authenticated locally. If there was a password defined, per our authentication order, we would authenticate the user via RADIUS first, and if we could not connect to the server, we’d fall back to a locally configured password.
Note
There are plenty of other options for getting permissions served centrally from the RADIUS server. Juniper publishes its own Vendor-Specific Attributes for RADIUS, which you can pass back to the system from RADIUS.
Accessing System Services: Control Plane Versus Data Plane
So we’ve discussed that the main system services that we interface exist on the control plane, for instance management and routing protocol subsystems. We know that Junos has an out-of-band management interface fxp0, which is a physical interface. Even on the branch, it’s physical, although it doesn’t necessarily have a dedicated interface that serves one purpose like that of the HE SRX and other M/MX/T platforms where fxp0 is located on the routing engine or on a specific port that’s hardcoded to be fxp0. That brings up an interesting scenario in many deployments where you might have both fxp0 and transit data interfaces that you might want to access the device for management. If you connect directly to fxp0 on the control plane, you are going to bypass the data plane, so therefore the security components on the data plane will not be applied to inbound or outbound connections to and from fxp0. On the other hand, any inbound or outbound connections to the SRX on the data plane will be subjected to the controls of the data plane, such as firewall or IPS policies and other access controls applied to the data plane. That doesn’t mean that you can’t have connections destined to or from the control plane if they go in or out fxp0 rather than the data plane; it just means that you cannot control them via firewall policy.
To control connections to the control plane, we can apply stateless filters either directly to fxp0 or to lo0 if we want it to apply to any inbound connection coming from either the control plane or data plane to interact with the control plane. Typically, applying the filter to lo0 is the best approach because it can provide you with an additional layer of protection, rather than only applying it to fxp0.
Configuring a stateless firewall filter to control traffic on fxp0
In this example, we configure a stateless filter that we will apply to the fxp0 interface, which will allow only SSH connections from IP address 192.168.1.20 along with ICMP from any address. All other traffic (including routing protocols) will be dropped.
[edit]
root@srx3600n0# set firewall family inet filter Restrict-FXP0 term SSH-Inbound from source-address 192.168.1.20

[edit]
root@srx3600n0# set firewall family inet filter Restrict-FXP0 term SSH-Inbound from destination-port 22

[edit]
root@srx3600n0# set firewall family inet filter Restrict-FXP0 term SSH-Inbound from protocol tcp

[edit]
root@srx3600n0# set firewall family inet filter Restrict-FXP0 term SSH-Inbound then accept log

[edit]
root@srx3600n0# set firewall family inet filter Restrict-FXP0 term ICMP-Any from protocol icmp

[edit]
root@srx3600n0# set firewall family inet filter Restrict-FXP0 term ICMP-Any then accept

[edit]
root@srx3600n0# set firewall family inet filter Restrict-FXP0 term Deny-Else then reject

[edit]
root@srx3600n0# set interfaces fxp0 unit 0 family inet filter input Restrict-FXP0

[edit]
root@srx3600n0# show firewall
family inet {
    filter Restrict-FXP0 {
        term SSH-Inbound {
            from {
                source-address {
                    192.168.1.20/32;
                }
                protocol tcp;
                destination-port 22;
            }
            then {
                log;
                accept;
            }
        }
        term ICMP-Any {
            from {
                protocol icmp;
            }
            then accept;
        }
        term Deny-Else {
            then {
                reject;
            }
        }
    }
}

[edit]
root@srx3600n0# show interfaces fxp0
unit 0 {
    family inet {
        filter {
            input Restrict-FXP0;
        }
        address 192.168.1.49/24;
    }
}
As we can see here, we have created a stateless firewall filter, which is different from a stateful security policy. This is a traditional access control list (ACL), which can be applied to either the control plane or the data plane, where security policies are applied to the data plane only and are stateful. Both stateless and stateful security policies can coexist on the data plane, where stateless policies are processed first. There is a great deal more configuration that can be discussed that is outside the scope of this book when it comes to stateless security policies. The goal here is to make you aware of stateless filters and how they can be applied to control fxp0 traffic.
Configuring a stateless firewall filter to control all inbound management traffic
In the previous example, we applied the firewall filter to the fxp0 interface only, meaning that the connection will be managed from fxp0 and not control connections that come into the data plane. Therefore, it is typically best to apply such filters to the loopback interface rather than to fxp0, so you can filter all connections whether they are terminated on fxp0 or a data plane interface. In this case, we would just apply the configuration to lo0 rather than fxp0. The difference here is that when applied to lo0, it will handle any traffic that is terminated to the device based on how the system services bind to interfaces internally.
[edit]
root@srx3600n0# set interfaces lo0 unit 0 family inet filter input Restrict-FXP0

[edit]
root@srx3600n0# show interfaces lo0
unit 0 {
    family inet {
        filter {
            input Restrict-FXP0;
        }
    }
}
In this example, we could have also placed this on a data plane interface like ge-0/0/0.0 if we wanted to restrict management traffic on only a single interface rather than on all.
Configuring a security policy to control data plane management traffic
With the data plane you have two options: you can either leverage stateless filters or, as of Junos 11.2r2+, you can also configure security policies to and from zone junos-host, including global policies. The junos-host zone is a special zone in which traffic either originates from (if in the from-zone field) or is destined to (if in the to-zone field) the SRX. There are several examples of controlling traffic with the full security policies on the data plane versus stateless filters, but as we mentioned, they will only take effect for traffic that enters on the data plane. If the traffic enters on the control plane, it will not be processed by the security policy, but you can still leverage the stateless firewall filters.
This example is covered at length in Chapter 8 alongside the security policies that handle transit traffic on the data plane.
Note
Before you can access any services on the data plane, you must configure the system service to be active on that zone. Otherwise, the traffic will never be processed by the security policy and will be dropped at the interface level. We discuss how to do this in the next section. This is also covered in more detail in Chapter 8.
Zone-Based Service Control
The SRX has an additional layer of security when it comes to system services that operate on the SRX, which is the “host-inbound-traffic” feature that can be configured on a per-zone or per-interface basis within each individual security zone. By default, a security zone has all system services disabled, which means that it will not accept any inbound management or protocol requests on the control plane without explicitly enabling the service per interface or zone in the security zone stanzas. This is done to help improve the posture of the SRX as a security device and follows a method similar to ScreenOS, where you needed to enable the service on a per-zone basis. Of course, the SRX takes it a step further, allowing you to leverage much more granular control over the management through security policies and leveraging additional system services, such as IPS, that can run on top of the security policies.
As mentioned, you can enable individual system services (management) and protocols (routing protocols) on an interface-by-interface or on a zone-by-zone basis. To best explain this, let’s look at an example.
Configuring system services and protocols per zone or interface
In this example, we configure two zones: trust and untrust. In the trust zone, there will be three interfaces: ge-0/0/0, ge-0/0/1.0, and ge-0/0/2.0. Allow all system services and protocols OSPF, BGP, and PIM on interface ge-0/0/0.0. Allow ping on all interfaces in the trust zone and DHCP on ge-0/0/2.0 On the untrust zone, only allow ping, traceroute, and VRRP on interface ge-0/0/4.0.
[edit]
root@srx3600n0# set security zones security-zone trust interfaces ge-0/0/0.0 host-inbound-traffic system-services all

[edit]
root@srx3600n0# set security zones security-zone trust interfaces ge-0/0/0.0 host-inbound-traffic protocols ospf

[edit]
root@srx3600n0# set security zones security-zone trust interfaces ge-0/0/0.0 host-inbound-traffic protocols bgp

[edit]
root@srx3600n0# set security zones security-zone trust interfaces ge-0/0/0.0 host-inbound-traffic protocols pim

[edit]
root@srx3600n0# set security zones security-zone trust interfaces ge-0/0/1.0

[edit]
root@srx3600n0# set security zones security-zone trust interfaces ge-0/0/2.0

[edit]
root@srx3600n0# set security zones security-zone trust host-inbound-traffic system-services ping

[edit]
root@srx3600n0# set security zones security-zone trust interfaces ge-0/0/2.0 host-inbound-traffic system-services dhcp

[edit]
root@srx3600n0# set security zones security-zone untrust interfaces ge-0/0/4.0 host-inbound-traffic system-services ping

[edit]
root@srx3600n0# set security zones security-zone untrust interfaces ge-0/0/4.0 host-inbound-traffic system-services traceroute

[edit]
root@srx3600n0# set security zones security-zone untrust interfaces ge-0/0/4.0 host-inbound-traffic protocols vrrp

[edit]
root@srx3600n0# show security zones
security-zone trust {
    host-inbound-traffic {
        system-services {
            ping;
        }
    }
    interfaces {
        ge-0/0/0.0 {
            host-inbound-traffic {
                system-services {
                    all;
                }
                protocols {
                    ospf;
                    bgp;
                    pim;
                }
            }
        }
        ge-0/0/1.0;
        ge-0/0/2.0 {
            host-inbound-traffic {
                system-services {
                    dhcp;
                }
            }
        }
    }
}
security-zone untrust {
    interfaces {
        ge-0/0/4.0 {
            host-inbound-traffic {
                system-services {
                    ping;
                    traceroute;
                }
                protocols {
                    vrrp;
                }
            }
        }
    }
}
Note
When you enable a service on an interface/zone, it is not changing how the system is listening for the service, but rather allowing that connection to come into the platform on the data plane (rather than using an implicit stateless firewall filter that blocks it on the data plane before it can reach the control plane). In other words, system services might be listening on all IP interfaces, but the data plane will prevent these services from being accessed by default by blocking them without explicitly allowing them with the configuration, as shown earlier. Additionally, there are other ways to limit access, including explicit stateless firewall filters, junos-host security policy rules (for the data plane only), and with some system services you can specify what interface it listens on, like J-Web.
Management Services
There are essentially four ways to manage the SRX (and other Junos platforms for that matter): CLI, web UI, Central Management (Junos Space/NSM), and via the Junos API NetConf. This section serves to show how you configure the individual management options we covered using the Junos CLI and the GUI management in earlier chapters. We also briefly discuss SNMP in this section, as it is a helpful mechanism to collect vital system information about the platform.
Command-Line Interfaces
There are essentially three CLI mechanisms to manage the SRX: the Console, Telnet, and SSH. Once you’re logged in, they are the same, but accessing them requires different protocols. The console is enabled by default. There is nothing that you need to do to enable it; you need only connect a console cable to the SRX. Telnet and SSH are not on by default and must be configured. SSH is a much better mechanism to manage the SRX because it is encrypted. We don’t recommend using Telnet unless it is an emergency or for open access like a public looking glass (not typically an SRX).
Configuring console options
There are a few options that you can leverage with the console port, including disabling it, securing the console when the cable is disconnected, root user control, and specifying the console type. In this example, we set the console to log out when the cable is disconnected and set the console to VT100.
root@srx3600n0# set system ports console ?
Possible completions:
+ apply-groups         Groups from which to inherit configuration data
+ apply-groups-except  Don't inherit configuration data from these groups
  disable              Disable console
  insecure             Disallow superuser access
  log-out-on-disconnect  Log out the console session when cable is unplugged
  type                 Terminal type
[edit]
root@srx3600n0# set system ports console log-out-on-disconnect type vt100

[edit]
root@srx3600n0# show system ports console
log-out-on-disconnect;
type vt100;
Configuring Telnet access
By default, Telnet is disabled. In this example, we configure Telnet on the SRX and set a limit of five concurrent Telnet connections. We only allow the connection through the fxp0 interface, so we won’t enable it on the zone configuration.
[edit]
root@srx3600n0# set system services telnet ?
Possible completions:
  <[Enter]>            Execute this command
+ apply-groups         Groups from which to inherit configuration data
+ apply-groups-except  Don't inherit configuration data from these groups
  connection-limit     Maximum number of allowed connections (1..250)
  rate-limit           Maximum number of connections per minute (1..250)
  |                    Pipe through a command
[edit]
root@srx3600n0# set system services telnet connection-limit 5

[edit]
root@srx3600n0# show system services
telnet {
    connection-limit 5;
}
Configuring SSH access
SSH is the preferred remote access mechanism for the SRX. It is authenticated and encrypted, so your connection is secure. Additionally, you can run SCP over SSH to transfer files without any special configuration. You can use popular SSH clients like Putty, OpenSSH, and SecureCRT to access a system using SSH. In this example, let’s configure SSH to be active on the SRX on both the control plane and on the trust interface ge-0/0/0.0. Disable root login via SSH, use only version 2, and restrict SSH to only five connections.
[edit]
root@srx3600n0# set system services ssh ?
Possible completions:
  <[Enter]>            Execute this command
+ apply-groups         Groups from which to inherit configuration data
+ apply-groups-except  Don't inherit configuration data from these groups
+ ciphers              Specify the ciphers allowed for protocol version 2
  client-alive-count-max  Threshold of missing client-alive responses that triggers a disconnect (1..255)
  client-alive-interval  Frequency of client-alive requests (0..65535 seconds)
  connection-limit     Maximum number of allowed connections (1..250)
> hostkey-algorithm    Specify permissible SSH host-key algorithms
+ key-exchange         Specify ssh key-exchange for Diffie-Hellman keys
+ macs                 Message Authentication Code algorithms allowed (SSHv2)
  max-sessions-per-connection  Maximum number of sessions per single SSH connection (1..65535)
  no-tcp-forwarding    Do not allow forwarding TCP connections via SSH
+ protocol-version     Specify SSH protocol versions supported
  rate-limit           Maximum number of connections per minute (1..250)
  root-login           Configure root access via SSH
  tcp-forwarding       Allow forwarding TCP connections via SSH
  |                    Pipe through a command
 [edit]
root@srx3600n0# set system services ssh root-login deny

root@srx3600n0# set system services ssh protocol-version v2

[edit]
root@srx3600n0# set system services ssh connection-limit 5

[edit]
root@srx3600n0# show system services ssh
root-login deny;
protocol-version v2;
connection-limit 5;

[edit]
root@srx3600n0# set security zones security-zone trust interfaces ge-0/0/0.0 host-inbound-traffic system-services ssh

[edit]
root@srx3600n0# show security zones
security-zone trust {
    interfaces {
        xe-1/0/0.0 {
        ge-0/0/0.0 {
            host-inbound-traffic {
                system-services {
                    ssh;
                }
            }
        }
    }
}
Note
At the time of writing this book, there is not an officially supported way to change the port that Telnet/SSH listens on; they only can use the predefined ports 23 and 22, respectively. It’s always a good idea to limit what machines can connect to your management services, and this might be a decent mechanism to do so. One option, if you need to have the system service listen on a nonstandard port on the data plane, is to leverage destination NAT to do an inbound port translation, but typically going to this length isn’t needed.
Additionally, you can upload the SSH public keys of your trusted clients so that you don’t need to use password authentication. This is also helpful if you are doing automated processing like NetConf or batch processing. To do this, you can load the keys manually with the key text, specify a location to upload the keys from, or manually type the key string. In this example, we’ve uploaded a trusted public key to the SRX in /var/tmp called ssh.pubkey, then we’ll use the import process to add it.
[edit]
root@srx3600n0# set security ssh-known-hosts load-key-file /var/tmp/ssh.pubkey
Import SSH host keys from trusted source /var/tmp/ssh.pubkey ? [yes,no] (no) yes
Although it is out of the scope of this chapter, you can also refer to configuring users in this book and in the Junos documentation for extensive support for user creation, permissions, authentication, and more when it comes to management sessions. This impacts both the CLI and the web UI.
Web Management on the SRX
By default, the web interface is disabled on the SRX for security reasons, but you can easily enable it with a few simple commands. You have the option to enable the web interface for both HTTP and HTTPS, including what logical interface to restrict it to and what port it should listen on. Because the web interface can be used for Dynamic VPN, you can specify which URL should be used rather than just using the base URL. Let’s look at an example where we enable HTTP on fxp0 port 80 and HTTPS on port 4430 on all interfaces. HTTPS should use the system-generated certificate. To keep the web management engine operating lean, allow no more than two concurrent users with a 60-minute logout.
[edit]
root@srx3600n0# set system services web-management session idle-timeout 60 session-limit 2

[edit]
root@srx3600n0# set system services web-management http interface fxp0

[edit]
root@srx3600n0# set system services web-management https port 4430 system-generated-certificate

[edit]
root@srx3600n0# show system services web-management
http {
    port 80;
    interface fxp0.0;
}
https {
    port 4430;
    system-generated-certificate;
    interface fxp0.0;
}
session {
    idle-timeout 60;
    session-limit 2;
}
Enabling NetConf over SSH
NetConf over SSH is used to allow automated control over the SRX using the NetConf XML RPC. This is not only the mechanism to operate remote Junos Script, but also how systems like Junos Space communicate with the SRX. Here we enable NetConf on port 2200 with a maximum of five connections.
[edit]
root@srx3600n0# set system services netconf ssh ?
Possible completions:
  <[Enter]>            Execute this command
+ apply-groups         Groups from which to inherit configuration data
+ apply-groups-except  Don't inherit configuration data from these groups
  connection-limit     Maximum number of allowed connections (1..250)
  port                 Service port number (1..65535)
  rate-limit           Maximum number of connections per minute (1..250)
  |                    Pipe through a command
[edit]
root@srx3600n0# set system services netconf ssh port 2200 connection-limit 5

[edit]
root@srx3600n0# show system services netconf
ssh {
    connection-limit 5;
    port 2200;
}
Note
A thorough discussion of Junos Script is outside the scope of this book because it can fill a book all on its own. There is an excellent Day One book on Junos Script, available for download for free from Juniper.
SNMP Management
Junos has one of the most extensive SNMP engines available for networking platforms. SNMP versions 1, 2c, and 3 are supported, including very extensive support for filtering requests and views, SNMP traps, automation over SNMP, and much more. SNMP is a powerful component to leverage not only for routing and switching platforms, but also for security. The SRX has finite storage facilities, so capturing long-term data for historical purposes is not a good option on the SRX. Instead, you can leverage third-party SNMP solutions that can poll, manipulate, and store SNMP data. There are both free solutions like MRTG, Nagios/Groundwork, and Cacti, as well as a wealth of commercial options like Solar Winds, Groundwork (commercial versions), OpenView, E-Health, and many others. They can provide much more functionality with reporting and alerting as well.
Configuring SNMP Management
Let’s take a look at configuring an SNMP example for the SRX so we can monitor it with a solution like Cacti. For simplicity, we’ll just demonstrate using SNMP v2c, which only leverages the community string for authentication. SNMP v2 is not encrypted so it is not the most secure solution, but it is fast to deploy. SNMP v3 is recommended for security, especially if the traffic is going over nonmanagement networks or is being used to alter the configuration. The configuration for SNMPv3 is much more extensive and requires a bunch of different concepts that are outside the scope of this book. In this example, we’ll restrict SNMP to the fxp0 interface with client 192.168.1.50. The client should have read-only rights on Community SNMP-Community-2c.
[edit]
root@srx3600n0# set snmp ?
Possible completions:
+ apply-groups         Groups from which to inherit configuration data
+ apply-groups-except  Don't inherit configuration data from these groups
> client-list          Client list
> community            Configure a community string
  contact              Contact information for administrator
  description          System description
> engine-id            SNMPv3 engine ID
  filter-duplicates    Filter requests with duplicate source address/port and request ID
> filter-interfaces    List of interfaces that needs to be filtered
> health-monitor       Health monitoring configuration
+ interface            Restrict SNMP requests to interfaces
  location             Physical location of system
  logical-system-trap-filter  Allow only logical-system specific traps
  name                 System name override
> nonvolatile          Configure the handling of nonvolatile SNMP Set requests
> proxy                SNMP proxy configuration
> rmon                 Remote Monitoring configuration
> routing-instance-access  SNMP routing-instance options
> traceoptions         Trace options for SNMP
> trap-group           Configure traps and notifications
> trap-options         SNMP trap options
> v3                   SNMPv3 configuration information
> view                 Define MIB views
 [edit]
root@srx3600n0# set snmp interface fxp0 community SNMP-Community-2c clients 192.168.1.50/32

[edit]
root@srx3600n0# set snmp community SNMP-Community-2c authorization read-only

root@srx3600n0# show snmp
interface fxp0.0;
community SNMP-Community-2c {
    authorization read-only;
    clients {
        192.168.1.50/32;
    }
}
Note
By default, Junos SNMP is v1/2c compatible, but you need to explicitly define if you want to use SNMP v3 with the appropriate configuration.
Configuring SNMP Traps
SNMP traps provide an efficient way to signal when certain conditions are reached on the device. To configure an SNMP trap, you need to define both what to trigger the trap on and where to send it with the appropriate community string. There are mechanisms to further limit SNMP traps, define traps based on changing values (Remote Monitor, or RMON), and many more—however, due to brevity and the advanced nature of the SNMP system, those are outside of the scope of this book. There is extensive information about using SNMP traps on Junos in the JUNOS Cookbook and in the documentation.
For this example, we’ll limit the type of traps that are sent to just Chassis, Chassis-Cluster, Configuration, and Startup rather than sending all SNMP traps. Send the traps using community Desired-Traps to server 192.168.1.200. Ensure that the traps appear to come from the fxp0 interface regardless of the routing. For this example, fxp0 has an IP address of 192.168.2.50.
[edit]
root@srx3600n0# set snmp trap-group Desired-Traps version v2 targets 192.168.1.200

[edit]
root@srx3600n0# set snmp trap-group Desired-Traps categories ?
Possible completions:
+ apply-groups         Groups from which to inherit configuration data
+ apply-groups-except  Don't inherit configuration data from these groups
  authentication       Authentication failures
  chassis              Chassis or environment notifications
  chassis-cluster      Clustering notifications
  configuration        Configuration notifications
  link                 Link up-down transitions
> otn-alarms           OTN alarm trap subcategories
  remote-operations    Remote operations
  rmon-alarm           RMON rising and falling alarms
  routing              Routing protocol notifications
  services             Services notifications
> sonet-alarms         SONET alarm trap subcategories
  startup              System warm and cold starts
  vrrp-events          VRRP notifications
[edit]
root@srx3600n0# set snmp trap-group Desired-Traps categories chassis

[edit]
root@srx3600n0# set snmp trap-group Desired-Traps categories chassis-cluster

[edit]
root@srx3600n0# set snmp trap-group Desired-Traps categories configuration

[edit]
root@srx3600n0# set snmp trap-group Desired-Traps categories startup

[edit]
root@srx3600n0# set snmp trap-options source-address 192.168.2.50

[edit]
root@srx3600n0# show snmp
trap-options {
    source-address 192.168.2.50;
trap-group Desired-Traps {
    version v2;
    categories {
        chassis;
        startup;
        configuration;
        chassis-cluster;
    }
    targets {
        192.168.1.200;
    }
}
SNMP in High Availability Chassis Clusters
When using high availability chassis clusters, you should ideally be using fxp0 interfaces on each node of the cluster as a best practice. Although this isn’t strictly required, it allows you to manage each device independently. In the case of SNMP, if you manage it through the reth interface or fxp0 using master-only configuration, then you will only get the active control plane in the cluster, so you might miss out on stats for the standby control plane (remember, even in active/active, one control plane is active and one is passive; more discussion on this can be found in Chapter 7). If you can use fxp0 on both members of the cluster, then you will be able to poll both devices independently.
Junos SNMP MIB
If you are familiar with SNMP (or even if this was your first time), you’ll be wondering what SNMP values you should be monitoring for when it comes to SNMP polling (since we covered how to send SNMP traps earlier). The good news is that Juniper publishes their SNMP MIB to define what Object Identifier (OID) values can be used to poll for specific information. The bad news is that it is truly massive. Most SNMP platforms are aware of the standard enterprise MIB for pulling standard values, but there are all sorts of custom objects that you might be interested in as an administrator for the SRX. The Junos MIB is published with the Junos software for each release of Junos because it can change when new OIDs are added; just look at the download location. In terms of what MIBs you should be monitoring, Table 5-1 lists some that are of interest.
Feature | MIB title |
Firewall Filters |
|
NAT |
|
Security Policies |
|
Screens |
|
IPsec |
|
IPS |
|
UTM |
|
Authentication |
|
SPU Monitoring |
|
High Availability |
|
Interface/Security Stats |
|
Configuration Management |
|
License MIB |
|
The list in Table 5-1 is not complete, and in reality you will need to actually view the MIB objects themselves in a MIB browser to provide the full detailed description for each object that is part of the MIB. The good news is that you can download all the MIBs for each SRX release under the documentation for each SRX release. Then, load up the MIB into a MIB browser like iReasoning or OID’s MIB Browser. Commercial SNMP monitoring tools typically also have mechanisms to import MIBs and select what values to pull.
One nifty trick is that you don’t actually need to use a
separate MIB browser to view the actual values on the SRX; you can just
use the show snmp mib walk
<OID> command to crawl the MIB structure and pull all
values under it. Here we can see the output of looking at an SRX3600
with seven SPCs in slots 3–9. You can see the CPU, Memory, Session, Max
Session, and CP Session values.
root@srx3600n0> show snmp mib walk jnxJsSPUMonitoringMIB
jnxJsSPUMonitoringFPCIndex.3 = 3
jnxJsSPUMonitoringFPCIndex.4 = 4
jnxJsSPUMonitoringFPCIndex.5 = 5
jnxJsSPUMonitoringFPCIndex.6 = 6
jnxJsSPUMonitoringFPCIndex.7 = 7
jnxJsSPUMonitoringFPCIndex.8 = 8
jnxJsSPUMonitoringFPCIndex.9 = 9
jnxJsSPUMonitoringSPUIndex.3 = 0
jnxJsSPUMonitoringSPUIndex.4 = 0
jnxJsSPUMonitoringSPUIndex.5 = 0
jnxJsSPUMonitoringSPUIndex.6 = 0
jnxJsSPUMonitoringSPUIndex.7 = 0
jnxJsSPUMonitoringSPUIndex.8 = 0
jnxJsSPUMonitoringSPUIndex.9 = 0
jnxJsSPUMonitoringCPUUsage.3 = 0
jnxJsSPUMonitoringCPUUsage.4 = 0
jnxJsSPUMonitoringCPUUsage.5 = 0
jnxJsSPUMonitoringCPUUsage.6 = 0
jnxJsSPUMonitoringCPUUsage.7 = 0
jnxJsSPUMonitoringCPUUsage.8 = 0
jnxJsSPUMonitoringCPUUsage.9 = 0
jnxJsSPUMonitoringMemoryUsage.3 = 69
jnxJsSPUMonitoringMemoryUsage.4 = 68
jnxJsSPUMonitoringMemoryUsage.5 = 68
jnxJsSPUMonitoringMemoryUsage.6 = 68
jnxJsSPUMonitoringMemoryUsage.7 = 68
jnxJsSPUMonitoringMemoryUsage.8 = 69
jnxJsSPUMonitoringMemoryUsage.9 = 69
jnxJsSPUMonitoringCurrentFlowSession.3 = 0
jnxJsSPUMonitoringCurrentFlowSession.4 = 0
jnxJsSPUMonitoringCurrentFlowSession.5 = 0
jnxJsSPUMonitoringCurrentFlowSession.6 = 0
jnxJsSPUMonitoringCurrentFlowSession.7 = 0
jnxJsSPUMonitoringCurrentFlowSession.8 = 0
jnxJsSPUMonitoringCurrentFlowSession.9 = 0
jnxJsSPUMonitoringMaxFlowSession.3 = 131072
jnxJsSPUMonitoringMaxFlowSession.4 = 262144
jnxJsSPUMonitoringMaxFlowSession.5 = 262144
jnxJsSPUMonitoringMaxFlowSession.6 = 262144
jnxJsSPUMonitoringMaxFlowSession.7 = 262144
jnxJsSPUMonitoringMaxFlowSession.8 = 262144
jnxJsSPUMonitoringMaxFlowSession.9 = 262144
jnxJsSPUMonitoringCurrentCPSession.3 = 0
jnxJsSPUMonitoringCurrentCPSession.4 = 0
jnxJsSPUMonitoringCurrentCPSession.5 = 0
jnxJsSPUMonitoringCurrentCPSession.6 = 0
jnxJsSPUMonitoringCurrentCPSession.7 = 0
jnxJsSPUMonitoringCurrentCPSession.8 = 0
jnxJsSPUMonitoringCurrentCPSession.9 = 0
jnxJsSPUMonitoringMaxCPSession.3 = 2359296
jnxJsSPUMonitoringMaxCPSession.4 = 0
jnxJsSPUMonitoringMaxCPSession.5 = 0
jnxJsSPUMonitoringMaxCPSession.6 = 0
jnxJsSPUMonitoringMaxCPSession.7 = 0
jnxJsSPUMonitoringMaxCPSession.8 = 0
jnxJsSPUMonitoringMaxCPSession.9 = 0
jnxJsSPUMonitoringNodeIndex.3 = 0
jnxJsSPUMonitoringNodeIndex.4 = 0
jnxJsSPUMonitoringNodeIndex.5 = 0
jnxJsSPUMonitoringNodeIndex.6 = 0
jnxJsSPUMonitoringNodeIndex.7 = 0
jnxJsSPUMonitoringNodeIndex.8 = 0
jnxJsSPUMonitoringNodeIndex.9 = 0
jnxJsSPUMonitoringNodeDescr.3 = single
jnxJsSPUMonitoringNodeDescr.4 = single
jnxJsSPUMonitoringNodeDescr.5 = single
jnxJsSPUMonitoringNodeDescr.6 = single
jnxJsSPUMonitoringNodeDescr.7 = single
jnxJsSPUMonitoringNodeDescr.8 = single
jnxJsSPUMonitoringNodeDescr.9 = single
jnxJsSPUMonitoringCurrentTotalSession.0 = 0
jnxJsSPUMonitoringMaxTotalSession.0 = 1703936
jnxJsClusterMonitoringNodeIndex.0 = 0
jnxJsClusterMonitoringNodeDescr.0 = single
jnxJsNodeCurrentTotalSession.0 = 0
jnxJsNodeMaxTotalSession.0 = 1703936
jnxJsNodeSessionCreationPerSecond.0 = 0
Networking Services
The SRX is a very powerful platform that can not only offer services to manage itself, but also provide functionality on the network itself. The SRX itself will use services like Network Time Protocol (NTP), DNS, and possibly DHCP, but it can also leverage those to provide these services on the data plane. In this section, we discuss the configuration for primary system services that the SRX operates.
Network Time Protocol
The importance of using NTP on the SRX cannot be overstated! It’s always a best practice to leverage proper timekeeping on any computer system, but for the SRX it is even more important. For starters, without proper timekeeping, the clocks will drift, making your security logs and platform events out of sync with the actual time, in turn making troubleshooting more difficult. Next, when using some time-based features like schedulers, not having NTP properly sync the time will mean that you might have security policies activated at incorrect times. Finally, on the HE SRX, the SPUs have to use NTP to get updates on the SPUs in the data plane. Without this, it can cause issues with features like IPsec and others. To make life simple, use NTP!
Manually configuring SRX time
When you are getting the system set up initially, it can be helpful to manually set the date and time, especially when the SRX isn’t fully on the network. The time will be kept even when power is off using the lithium battery on the control plane (assuming it doesn’t fail), but it is still a good idea to run NTP to prevent clock drift.
root@srx3600n0> set date 201212151855.25
Sat Dec 15 18:55:25 UTC 2012
It’s important to note that we are running this command in operational mode, not configuration mode, as this isn’t entered into the configuration.
Configuring the SRX as an NTP client
In this example, we configure the SRX to get its time from an NTP server at IP address 192.168.1.20. We also trigger the NTP client to initiate a request manually.
[edit]
root@srx3600n0# set system ntp server 192.168.1.20

[edit]
root@srx3600n0# show system ntp
server 192.168.1.20;


[edit]
root@srx3600n0#commit

root@srx3600n0> set date ntp
 9 Dec 23:50:15 ntpdate[21105]: step time server 192.168.1.20 offset −0.000055 sec
As you can see, there isn’t too much to the NTP Client configuration. There are some additional options to specify what version of NTP to use, what the source address is (to override the loopback interface/preferred interface address), and also to use authentication if you have that configured on your NTP server. You can trigger a manual NTP clock sync was we did previously. If you don’t specify anything beyond “set date ntp” in operational mode, then it will sync from the first NTP server; otherwise, you can specify what server to sync from.
Note
You might also notice that there is another option called “peer” rather than server in the NTP configuration. The difference is that the server option instructs the SRX to accept the time from the NTP server, whereas the peer statement instructs the SRX to do a symmetric time sync between it and the NTP server (which must also be configured for this).
Configuring the SRX as an NTP server
The SRX itself can act as a time server to clients on the network. Besides configuring the SRX to operate the NTP server and specify the parameters, you also need to make sure that the SRX is configured to allow inbound system services. This includes the following:
Enabling the system server per interface/zone.
Configuring a security policy (if using global/junos-host policies).
Configuring firewall filters to permit it (if using firewall filters on data plane interface/loopback interfaces).
For the SRX, there are two NTP modes: one is to broadcast the NTP traffic on each interface on which it is active and the other is to operate on demand. You merely need to leverage the broadcast option to do broadcast. So let’s configure the SRX to get its time from NTP server 192.168.1.20 and to serve it on interface ge-0/0/0.0 in the trust zone.
[edit]
root@srx3600n0# set system ntp server 192.168.1.20

[edit]
root@srx3600n0# show system ntp
server 192.168.1.20;

[edit]
root@srx3600n0# set security zones security-zone trust interfaces ge-0/0/0.0 host-inbound-traffic system-services ntp

[edit]
root@srx3600n0# show security zones security-zone trust
interfaces {
    ge-0/0/0.0 {
        host-inbound-traffic {
            system-services {
                ntp;
            }
        }
    }
}
Wait a minute: what’s the difference here between configuring the SRX as a client as opposed to a server, besides the fact that in the server mode, we’re enabling the SRX to accept inbound connections for NTP on the ge-0/0/0.0 trust interface? The answer is that the SRX will implicitly act as a time server if you have configured it to get an upstream time source. You still need to configure the SRX to accept the inbound traffic on the respective interface or zone for the host-inbound traffic and, optionally, security policy and firewall filters if you are using them to filter inbound traffic to the device.
Domain Name System
We all know the benefits of leveraging DNS in our daily browsing lives. Without it, we’d be forced to memorize IP addresses for every server we want to access, it would be much harder to multiplex different web applications to the same server, and a lot of high availability would be limited without being able to serve up new addresses. When it comes to the SRX, it can act as a client for DNS, which is important so it can access resources by name. The SRX can also act as a DNS Proxy (or server) so that internal machines do not need to reference external servers directly. When acting as a DNS proxy, it can also be configured to rewrite certain requests if the DNS application layer gateway (ALG) is enabled.
Configuring the SRX as a DNS client
Using DNS is not a strict requirement to operate the SRX, but it makes it much easier than entering static name entries. Let’s configure the SRX to get its DNS updates from server 192.168.1.20, but also make a static mapping for an internal host that doesn’t have a DNS entry in the server; map ICMPServer.company.local to 192.168.1.30.
[edit]
root@srx3600n0# set system name-server 192.168.1.20

[edit]
root@srx3600n0# show system name-server
192.168.1.20;

[edit]
root@srx3600n0# set system static-host-mapping ICMPServer.company.local inet 192.168.1.30

[edit]
root@srx3600n0# show system static-host-mapping
ICMPServer.company.local inet 192.168.1.30;
As you can see, there is very little to configure when it comes to DNS as a client on the SRX; simply specify the nameserver and that’s all. You can also specify more than one server if you wish. We also showed how to configure static-host mappings if you have an entry that must be hardcoded.
Configuring the SRX as a proxy server
The SRX can also be configured as a proxy server for internal clients. Let’s configure an example that forwards DNS requests that are not known to public server 4.2.2.2, sets a max TTL of 600 seconds for any entry regardless of what TTL the server provides, and allows clients on interface ge-0/0/0.0 to query the SRX.
[edit]
root@srx3600n0# set system services dns forwarders 4.2.2.2

[edit]
root@srx3600n0# set system services dns max-cache-ttl 600

[edit]
root@srx3600n0# set security zones security-zone trust interfaces ge-0/0/0.0 host-inbound-traffic system-services dns

[edit]
root@srx3600n0# show system services dns
max-cache-ttl 600;
forwarders {
    4.2.2.2;
}

[edit]
root@srx3600n0# show security zones security-zone trust
interfaces {
    ge-0/0/0.0 {
        host-inbound-traffic {
            system-services {
                dns;
            }
        }
    }
}
Dynamic Host Configuration Protocol
The SRX supports DHCP both as a server to distribute IP address information to hosts on the connected subnet and as a DHCP client itself to receive an address from a server. There are truly far too many DHCP configurations to discuss in a single book. The Junos DHCP implementation is quite extensive and offers all sorts of capabilities to define custom DHCP options. In this section, we focus on the three most common DHCP configurations: the SRX as a DHCP server, the SRX as a DHCP client (most common on the branch SRX), and the SRX as a DHCP relay.
Configuring the SRX as a DHCP server
When it comes to defining a DHCP server, you need to define at least the subnet on which the server will be active (which will imply to the interface it should respond to DHCP requests) and the address range that should be served. Most commonly, you’ll also define the gateway IP address, a DNS server, and the DHCP lease time, which is a good idea—particularly in a busy environment like a corporate environment or open access point where IP addresses can be used up quickly if not released when idle. In this example, we configure the SRX to serve up the IP addresses 172.16.1.2 through 172.16.1.253 on interface ge-0/0/1, which is in the Clients zone. The IP address of the clients interface is 172.16.1.1. Because this is on a corporate network, we set a four-hour lease time. Also, configure this pool to propagate the server configuration on interface ge-0/0/0.0, which we configure in the next example.
[edit]
root@srx3600n0# set system services dhcp pool 172.16.1.0/24 address-range low 172.16.1.2

[edit]
root@srx3600n0# set system services dhcp pool 172.16.1.0/24 address-range high 172.16.1.253

[edit]
root@srx3600n0# set system services dhcp pool 172.16.1.0/24 router 172.16.1.1

[edit]
root@srx3600n0# set system services dhcp pool 172.16.1.0/24 default-lease-time 14400

[edit]
root@srx3600n0# set system services dhcp pool 172.16.1.0/24 propagate-settings ge-0/0/0.0

[edit]
root@srx3600n0# show system services dhcp
pool 172.16.1.0/24 {
    address-range low 172.16.1.2 high 172.16.1.253;
    default-lease-time 14400;
    router {
        172.16.1.1;
    }
    propagate-settings ge-0/0/0.0;
}

[edit]
root@srx3600n0# set interfaces ge-0/0/1 unit 0 family inet address 172.16.1.1/24

[edit]
root@srx3600n0# set security zones security-zone Clients interfaces ge-0/0/1 host-inbound-traffic system-services dhcp

[edit]
root@srx3600n0# show security zones security-zone Clients
interfaces {
    ge-0/0/1.0 {
        host-inbound-traffic {
            system-services {
                dhcp;
            }
        }
    }
}

[edit]
root@srx3600n0# show interfaces ge-0/0/1
unit 0 {
    family inet {
        address 172.16.1.1/24;
    }
}
Reviewing this example, we notice a few things. First, the DHCP server is defined under System Services. You see that you define DHCP on a subnet-by-subnet basis. The system infers what interface to use to respond to the DHCP requests based on the subnet being matched up to an interface subnet in the DHCP pool configuration. Within the DHCP pool, you must define the IP range to be handed out to clients. You can define addresses that should be excluded from the contiguous range, and you can also explicitly define IP-to-MAC address mapping for reserved addresses. Many fields and behaviors can be defined in the DHCP pool. In our example, we defined the most common options like the default gateway for the clients (router option), the nameservers that the clients should query (name-server), and a lease time. The SRX can even serve up custom DHCP options of your choosing!
The interesting thing, which is very easy to forget, is that when serving up DHCP on the SRX, you must enable DHCP on the zone configuration as an allowed system service. If not, the SRX will never send the DHCP query from the client up to the routing engine. This is very easy to overlook. Another thing that might not be overtly obvious is that the DHCP service is only configurable in the zone configuration under the interface host-inbound traffic configuration rather than at the zone level itself.
Configuring the SRX as a DHCP client
When the SRX is installed in a Customer Premise Equipment (CPE) use case, common in branch deployments, it often does not have a static predefined public IP address. The SRX does support not only serving up IP addresses, but also receiving them itself on an interface. Most often this is done on the Internet-facing interface.
In this example, we configure the ge-0/0/0 interface as a DHCP client to get an IP address from the upstream provider. Configure the DHCP client to update the DHCP server with the parameters received.
[edit]
root@srx3600n0# set interfaces ge-0/0/0 unit 0 family inet dhcp update-server

[edit]
root@srx3600n0# set security zones security-zone untrust interfaces ge-0/0/0.0 host-inbound-traffic system-services dhcp

[edit]
root@srx3600n0# show interfaces ge-0/0/0
unit 0 {
    family inet {
        dhcp {
            update-server;
        }
    }
}
[edit]
root@srx3600n0# show security zones security-zone untrust
interfaces {
    ge-0/0/0.0 {
        host-inbound-traffic {
            system-services {
                dhcp;
            }
        }
    }
}
In this example, we have defined the ge-0/0/0 interface to act as a DHCP client. The configuration is quite straightforward, as you can see. To add in the plug-and-play deployment of a CPE device, we update the server parameters with the upstream information (such as DNS servers) provided by the upstream provider server. Just like the DHCP server example, we must define the untrust zone to accept DHCP messages; otherwise, they will be blocked on the data plane itself.
Configuring the SRX as a DHCP relay server
DHCP is, by default, a broadcast protocol that is not ordinarily exchanged across Layer 3 boundaries. The issue here is that often you might want to have a central DHCP server that can control DHCP centrally rather than having every Layer 3 device be responsible for serving up DHCP addresses locally. Because DHCP is only provided at a Layer 3 boundary, each Layer 3 device must be able to accept the request and forward it on to the appropriate DHCP server. In this example, we configure the SRX to listen for DHCP requests on interface ge-0/0/3.0 in the Clients-2 zone and forward them to the server at IP address 10.1.0.2, which is off interface ge-0/0/4.0 in the Servers zone.
[edit]
root@srx3600n0# set forwarding-options helpers bootp interface ge-0/0/3.0 server 10.1.0.2

[edit]
root@srx3600n0# set security zones security-zone Clients-2 interfaces ge-0/0/3.0 host-inbound-traffic system-services dhcp

[edit]
root@srx3600n0# set security zones security-zone Servers interfaces ge-0/0/4.0 host-inbound-traffic system-services dhcp

[edit]
root@srx3600n0# show forwarding-options
helpers {
    bootp {
        interface {
            ge-0/0/3.0 {
                server 10.1.0.2;
            }
        }
    }
}


[edit]
root@srx3600n0# show security zones
security-zone Clients-2 {
    interfaces {
        ge-0/0/3.0 {
            host-inbound-traffic {
                system-services {
                    dhcp;
                }
            }
        }
    }
}
security-zone Servers {
    interfaces {
        ge-0/0/4.0 {
            host-inbound-traffic {
                system-services {
                    dhcp;
                }
            }
        }
    }
}
In this example, we see that the DHCP Server Relay configuration is primarily configured under the “set forwarding-options helpers” configuration. Here, you define the interface that the SRX should listen to for the inbound DHCP request along with the IP address of the DHCP server to which all requests should be forwarded. The interesting thing in this example is that we must configure DHCP in the security zone host-inbound traffic configuration for both the interface that the traffic is received on along with the interface that requests are forwarded to the server (even if not on the same local interface as the server); otherwise, the SRX will drop the requests.
SRX Logging and Flow Records
Proper logging is one of the most important things that is often overlooked when it comes to firewall management. The SRX collects a great deal of information when processing firewall sessions; however, due to restrictions of storing this real-time information, after the session is complete, the information will be deleted from the system tables—with the exception of counters, which are usually too high level to get specific information about individual sessions. Logging provides you a way to export this information to an external system for logging, reporting, security intelligence, forensics, and other traffic visibility functions. The SRX leverages three types of syslog formats for this function, along with JFlow record export. The SRX can log information sourced from both the control plane and data plane—including sending the information externally or storing it locally on the control plane. In this section, we explore both control plane and data plane logging, and how to export it.
Control Plane Versus Data Plane Logs
As we mentioned, you can log messages from both the control plan and the data plane. So what’s the difference? Following the traditional Junos theme, the control plane logs have to do with events triggered by daemons on the control plane. This includes messages about the underlying hardware (chassisd), general-purpose messages (messages), and various protocol daemons like IDPD, appidd, and so on. Control plane logging is on by default to log locally, but you can override this with your own logfiles, syslog hosts, and criteria for different log messages. All logs are stored in the /var/log directory on the control plane.
Data plane logs, on the other hand, are primarily those generated by components that process traffic on the data plane. These include the firewall logs (RT_LOG, which stands for Real-Time Log because it is not stored on the data plane) from the flowd process, IPS logs, UTM logs, and logs from other security components like Screens. Data plane logging is off by default and must be configured. Typically, it is recommended that you send logs off the SRX to a syslog host due to the large volume of logs that can be generated from the data plane, particularly on high-end SRX platforms like the 5800. In fact, it can take an entire infrastructure of syslog servers to handle the large volume of syslog messages that the high-end SRX can generate per second. For this reason, there are two different mechanisms that we can use to log messages to the control plane, as discussed in the next section.
Data plane logs: Event versus Stream mode
The data plane supports two different ways to log messages. The first is Event mode, in which all log messages are logged to the control plane through the internal SRX infrastructure that lets the data plane communicate with the control plane—you need only configure Event mode along with a few optional settings and the logs will flow to the control plane. The other mode, Stream mode, is preferred. This logs messages directly from the data plane to an external source. The benefit of this that the SRX can log at extremely high rates (into the hundreds of thousands of logs per second). This is especially important when dealing with the distributed architecture of the high-end SRX. Of course, this is true of other security platforms as well—it is simply a difficult proposition to store large volumes of logs for historical purposes, particularly in high-demand environments.
Note
At the time of writing this book, the SRX can only log to the control plane (Event mode) or log out the data plane (Stream mode) at one time, so it is generally recommended to log out the data plane to an external syslog server.
Configuring control plane logging on the SRX
As we mentioned, control plane logs are enabled by default on the SRX and also allow you to configure your own logs to capture information as you see fit. In this example, we leverage three control plane logs.
First, we modify the default logfile interactive-commands to display only the commands that were logged, rather than showing their entire contents. Second, we log all security logs on the SRX of any severity to a file called Severity that will archive up to ten 1 million-byte files that can only be read by root. Finally, we log all control plane logs to our STRM server at host 192.168.1.100 port 514 using structured syslog.
[edit system syslog]
root@srx3600n0# set file interactive-commands match "command"

[edit system syslog]
root@srx3600n0# set file Security security any

[edit system syslog]
root@srx3600n0# set file Security archive files 10 size 1000000 no-world-readable

[edit system syslog]
root@srx3600n0# set host 192.168.1.100 port 514 any any

[edit system syslog]
root@srx3600n0# show
host 192.168.1.100 {
    any any;
    port 514;
}
file messages {
    any notice;
    authorization info;
}
file interactive-commands {
    interactive-commands any;
    match command;
}
file default-log-messages {
    any any;
    match "(requested 'commit' operation)|(copying configuration to juniper.save)|ifAdminStatus|(FRU power)|(FRU removal)|(FRU insertion)|(link UP)|(vc add)|(vc delete)|transitioned|Transferred|transfer-file|QFABRIC_NETWORK_NODE_GROUP|QFABRIC_SERVER_NODE_GROUP|QFABRIC_NODE|(license add)|(license delete)|(package -X update)|(package -X delete)|GRES|CFMD_CCM_DEFECT";
    structured-data;
}
file Security {
    security any;
    archive size 1000000 files 10 no-world-readable;
}

root@srx3600n0> show log ?
Possible completions:
  <[Enter]>            Execute this command
  <filename>           Name of log file
  __jsrpd_commit_check__  Size: 52, Last changed: Dec 11 02:02:32
  appid-log            Size: 97042, Last changed: Apr 12 2011
  appidd               Size: 0, Last changed: May 28 2010
  authd_libstats       Size: 0, Last changed: Jul 27 2011
  authd_profilelib     Size: 0, Last changed: Nov 01 2009
  authd_sdb.log        Size: 232, Last changed: Nov 03 2010
  authlib_jdhcpd_trace.log  Size: 0, Last changed: Jul 05 11:14:04
  bin_messages         Size: 7, Last changed: Nov 01 2011
  chassisd             Size: 2237124, Last changed: Dec 21 23:45:26
  chassisd.0.gz        Size: 194195, Last changed: Nov 26 18:29:18
  cosd                 Size: 2078339, Last changed: Dec 21 00:07:50
  cscript.log          Size: 387, Last changed: May 28 2010
  dcd                  Size: 542271, Last changed: Dec 21 00:13:31
  debug-idp.log        Size: 105748, Last changed: Jun 07 2011
  default-log-messages  Size: 720210, Last changed: Dec 21 00:13:31
  default-log-messages.0.gz  Size: 129653, Last changed: Nov 20 05:15:00
  default-log-messages.1.gz  Size: 128204, Last changed: Nov 11 02:45:00
  dfwc                 Size: 0, Last changed: Nov 01 2009
  dfwd                 Size: 208, Last changed: May 29 2010
  e2e_capture          Size: 9, Last changed: Dec 21 00:07:19
  e2e_events           Size: 779, Last changed: Dec 21 00:13:17
  eccd                 Size: 0, Last changed: Nov 01 2009
  escript.log          Size: 1680, Last changed: Apr 15 2011
  ext/                 Last changed: Nov 01 2009
  flowc/               Last changed: Nov 01 2009
  flowlog              Size: 0, Last changed: Nov 30 2010
  fwauthd_chk_only     Size: 297, Last changed: Dec 11 02:02:32
  ggsn/                Last changed: Nov 01 2009
  gprsd_chk_only       Size: 1135, Last changed: Dec 11 02:02:31
  gprsinfo_log         Size: 1136, Last changed: Sep 06 2011
  gres-tp              Size: 562248, Last changed: Dec 21 00:07:50
  group_db.log         Size: 0, Last changed: Jun 12 2011
  hostname-cached      Size: 11552, Last changed: Dec 11 02:02:34
  httpd.log            Size: 5634, Last changed: Dec 23 23:33:05
  httpd.log.old        Size: 8630, Last changed: Dec 21 00:04:45
  idpd                 Size: 97394, Last changed: Jul 26 2011
  idpd.addver          Size: 185, Last changed: Dec 21 00:17:03
  ifstraced            Size: 1803, Last changed: Dec 11 02:02:31
  ike                  Size: 17285, Last changed: Sep 23 2011
  install              Size: 967, Last changed: Dec 11 02:00:15
  install.0.gz         Size: 541, Last changed: Nov 27 15:16:53
  install.1.gz         Size: 543, Last changed: Nov 26 18:29:17
  install.2.gz         Size: 819, Last changed: Nov 11 00:09:22
  install.3.gz         Size: 905, Last changed: Nov 06 23:19:04
  interactive-commands  Size: 458242, Last changed: Dec 23 23:54:32
  interactive-commands.0.gz  Size: 70463, Last changed: Nov 27 17:30:00
  inventory            Size: 833339, Last changed: Dec 21 00:13:31
  jdhcpd_era_discover.log  Size: 594, Last changed: Jul 05 13:08:17
  jdhcpd_era_discover.log.0  Size: 594, Last changed: Jul 05 11:14:25
  jdhcpd_era_discover.log.1  Size: 0, Last changed: Jul 05 11:14:04
  jdhcpd_era_solicit.log  Size: 593, Last changed: Jul 05 13:08:17
  jdhcpd_era_solicit.log.0  Size: 593, Last changed: Jul 05 11:14:25
  jdhcpd_era_solicit.log.1  Size: 0, Last changed: Jul 05 11:14:04
  jdhcpd_profilelib    Size: 0, Last changed: Jul 05 11:14:04
  jdhcpd_sdb.log       Size: 0, Last changed: Jul 05 11:14:04
  jsrpd                Size: 942785, Last changed: Dec 21 00:13:31
  jsrpd_chk_only       Size: 43, Last changed: May 28 2010
  kmd                  Size: 800700, Last changed: Dec 21 00:13:31
  kmd.0.gz             Size: 37342, Last changed: Dec 16 16:08:37
  license              Size: 240, Last changed: May 28 2010
  license_subs_trace.log  Size: 242501, Last changed: Dec 21 00:07:50
  lsys-cpu-utilization-log  Size: 0, Last changed: Oct 19 2011
  mastership           Size: 279307, Last changed: Dec 21 00:07:18
  messages             Size: 522982, Last changed: Dec 23 23:54:32
  messages.0.gz        Size: 82394, Last changed: Dec 20 21:15:00
  messages.1.gz        Size: 112586, Last changed: Dec 11 02:15:00
  messages.2.gz        Size: 107409, Last changed: Nov 26 20:30:00
  messages.3.gz        Size: 138088, Last changed: Nov 12 18:30:00
  messages.4.gz        Size: 104667, Last changed: Nov 11 01:30:00
  messages.5.gz        Size: 68982, Last changed: Nov 09 18:00:00
  named                Size: 0, Last changed: Oct 17 14:27:16
  nsd_chk_only         Size: 39556, Last changed: Dec 20 18:59:45
  nstraced_chk_only    Size: 736, Last changed: Dec 11 02:02:32
  op-script.log        Size: 4789122, Last changed: Dec 23 19:27:54
  pcre_db.log          Size: 0, Last changed: Jun 12 2011
  pf                   Size: 17792, Last changed: Dec 11 02:02:28
  pfed                 Size: 167586, Last changed: Dec 21 00:07:50
  pfed_jdhcpd_trace.log  Size: 0, Last changed: Jul 05 11:14:04
  pfed_trace.log       Size: 0, Last changed: Nov 01 2009
  pgmd                 Size: 10471, Last changed: Dec 11 02:02:33
  rexp_db.log          Size: 2630, Last changed: Apr 20 2012
  rpc.log              Size: 1188687, Last changed: Oct 18 2011
  rtlogd               Size: 755636, Last changed: Dec 21 00:07:12
  sampled              Size: 5461, Last changed: May 28 2010
  sdxd                 Size: 0, Last changed: Nov 01 2009
  secdb_db.log         Size: 7557, Last changed: Jul 06 20:42:25
  slbd                 Size: 1806553, Last changed: Dec 23 23:48:09
  slbd_chk_only        Size: 546, Last changed: Apr 04 2012
  slbd_opcmd           Size: 0, Last changed: Dec 21 00:07:47
  smartd.trace         Size: 71914, Last changed: Dec 23 20:11:28
  snapshot             Size: 1955, Last changed: May 20 2012
  test-file            Size: 0, Last changed: Apr 11 2011
  user                 Show recent user logins
  utmp                 Size: 0, Last changed: Nov 01 2009
  wtmp                 Size: 210028, Last changed: Dec 23 23:54:25
  wtmp.0.gz            Size: 3372, Last changed: Dec 06 22:19:26
  wtmp.1.gz            Size: 27, Last changed: Nov 06 22:49:46
  |                    Pipe through a command

root@srx3600n0> show log interactive-commands
Nov 27 17:32:05  srx3600n0 mgd[1952]: UI_CMDLINE_READ_LINE: User 'root', command 'show security idp attack table | no-more '
Nov 27 17:32:06  srx3600n0 mgd[1955]: UI_CMDLINE_READ_LINE: User 'root', command 'show security idp counters packet | no-more '
Nov 27 17:32:07  srx3600n0 mgd[1958]: UI_CMDLINE_READ_LINE: User 'root', command 'show security idp counters memory | no-more '
Nov 27 17:32:07  srx3600n0 mgd[1961]: UI_CMDLINE_READ_LINE: User 'root', command 'show security idp counters flow | no-more '
Nov 27 17:32:08  srx3600n0 mgd[1964]: UI_CMDLINE_READ_LINE: User 'root', command 'show security idp counters application-identification | no-more '
Nov 27 17:32:08  srx3600n0 mgd[1967]: UI_CMDLINE_READ_LINE: User 'root', command 'clear security idp counters packet '
Nov 27 17:32:09  srx3600n0 mgd[1970]: UI_CMDLINE_READ_LINE: User 'root', command 'clear security idp counters flow '
Nov 27 17:32:09  srx3600n0 mgd[1973]: UI_CMDLINE_READ_LINE: User 'root', command 'clear security idp counters application-identification '
Nov 27 17:32:10  srx3600n0 mgd[1976]: UI_CMDLINE_READ_LINE: User 'root', command 'clear security idp attack table '
Nov 27 17:32:11  srx3600n0 mgd[1979]: UI_CMDLINE_READ_LINE: User 'root', command 'clear security flow session '
As you can see from the preceding output, we have
modified the predefined log interactive-commands
to only log commands that are entered on the platform, along with
defining a log called Security that logs any security-related events,
and we defined the SRX to log all control plane messages to our STRM
server at 192.168.1.100. You can view any logs by using the show log command followed by the name of the
logfile in the /var/log
directory. The SRX will compress logs and append a chronological
number as part of the archive process, and the show log command will automatically
decompress these. You can also leverage the standard Junos output
modifiers by using the pipe command
following the show log command. For
instance, we can view the contents of
interactive-commands, which include clear, as
follows:
root@srx3600n0> show log interactive-commands | ?
Possible completions:
  count                Count occurrences
  display              Show additional kinds of information
  except               Show only text that does not match a pattern
  find                 Search for first occurrence of pattern
  hold                 Hold text without exiting the --More-- prompt
  last                 Display end of output only
  match                Show only text that matches a pattern
  no-more              Don't paginate output
  request              Make system-level requests
  resolve              Resolve IP addresses
  save                 Save output text to file
  trim                 Trim specified number of columns from start of line

root@srx3600n0> show log interactive-commands | match clear
Nov 27 17:32:08  srx3600n0 mgd[1967]: UI_CMDLINE_READ_LINE: User 'root', command 'clear security idp counters packet '
Nov 27 17:32:09  srx3600n0 mgd[1970]: UI_CMDLINE_READ_LINE: User 'root', command 'clear security idp counters flow '
Nov 27 17:32:09  srx3600n0 mgd[1973]: UI_CMDLINE_READ_LINE: User 'root', command 'clear security idp counters application-identification '
Nov 27 17:32:10  srx3600n0 mgd[1976]: UI_CMDLINE_READ_LINE: User 'root', command 'clear security idp attack table '
Nov 27 17:32:11  srx3600n0 mgd[1979]: UI_CMDLINE_READ_LINE: User 'root', command 'clear security flow session '
Nov 27 17:32:35  srx3600n0 mgd[1982]: UI_CMDLINE_READ_LINE: User 'root', command 'clear services application-identification application-system-cache '
Nov 27 17:35:24  srx3600n0 mgd[2020]: UI_CMDLINE_READ_LINE: User 'root', command 'clear security idp counters packet '
Nov 27 17:35:25  srx3600n0 mgd[2023]: UI_CMDLINE_READ_LINE: User 'root', command 'clear security idp counters flow '
Nov 27 17:35:26  srx3600n0 mgd[2026]: UI_CMDLINE_READ_LINE: User 'root', command 'clear security idp counters application-identification '
Nov 27 17:35:26  srx3600n0 mgd[2029]: UI_CMDLINE_READ_LINE: User 'root', command 'clear security idp attack table '
Configuring Stream mode logging on the data plane
Stream mode is preferred for data plane logging on the SRX due to the architecture and massive rate of logs that can be produced. Configuring Stream mode is very simple: you simply define the stream properties, and define the IP address/port of the syslog collector along with the format of the logs. There are optional properties for source address, category (SRX Branch), and severity filters as well. In this example, we configure the data plane logs to send to the STRM server with structured syslog on IP address 192.168.1.100 port 514.
[edit]
root@srx3600n0# set security log mode stream source-address 192.168.1.1 format sd-syslog stream STRM-192.168.1.100 host 192.168.1.100 port 514

[edit]
root@srx3600n0# show security log
mode stream;
format sd-syslog;
source-address 192.168.1.1;
stream STRM-192.168.1.100 {
    host {
        192.168.1.100;
        port 514;
    }
}
Let’s analyze this output. At the root level of “security log” we have defined the mode to be Stream. As we mentioned earlier, at the time of writing this book, the SRX can only be in either Stream mode (log out the data plane) or Event mode (log from the data plane to the control plane) at one time. There are four different log formats at the time of writing this book: standard syslog, structured syslog, Webtrends Log Format (WELF), and binary syslog. Here we have chosen to use structured syslog, which is by far the most common. By default, the SRX will assign the source address to whatever the egress interface is for the data plane logs, but for other reasons, you might want the source address to show up as something else on your syslog collector (e.g., the IP address of your loopback interface). Finally, we have defined our “stream” object, which is called STRM-192.168.1.100 (the name is arbitrary), along with the IP/port of the collector.
Syslog format types
Regarding the different types of syslog formats, the overall function and differences are as follows:
- Standard
Messages are sent exactly as generated in the system as an ASCII text string.
- Structured
Similar to standard syslog but each field is prepended with a label, such as
source-address=192.168.1.1; standard syslog would just list the IP address itself, 192.168.1.1, and not prepend the label. Structured is best leveraged, particularly when using third-party syslog servers that might not know which field applies to which value. By leveraging the label of structured syslog, a third-party product can receive the information without any special configuration and parse it. Like standard syslog, it is ASCII based, although it does use more bytes than standard syslog due to labeling each field.- Binary
Binary syslog is a relatively new feature that is the best of both worlds of structured and standard syslog, but at a reduced byte count. As we mentioned, standard syslog and structured syslog are in ASCII format as text, which means that they are not efficient when it comes to log volume, particularly at high speed. Binary is a predefined log format defined by a log dictionary (provided by Juniper on the download site per version) that defines exactly which bit fields stand for which value so the SRX does not need to use any labels, but can leverage binary versus ASCII, resulting in dramatically smaller logs. For instance, if we were to represent an IP address in 8-bit ASCII, the IP address field for
source-address=192.168.1.1would be 11 bytes in standard syslog (ASCII for the IP address 192.168.1.1.), 26 bytes for structured (due to the 11 bytes of the IP address + the 15-byte label), or 4 bytes for binary because it would list out the IP address directly in binary bit notation and would not need to use any label, as each bit of the message maps to a predefined field as defined by the dictionary file, which must be installed on the syslog collector. This format is promising, but does require support for binary logging which isn’t supported by all third-party platforms.- WELF
Similar to structured but provides a specific ASCII format for exchanging logs. This is best leveraged with Webtrends reporting servers.
Configuring Event mode logging to the control plane
When dealing with smaller SRX deployments or in environments without a syslog server, you can use Event mode logging to log all data plane logs to the control plane through an internal channel rather than out the data plane. This is known as Event mode logging. As we mentioned, you can only log in Stream or Event mode at one time on the SRX. In this example, we log all data plane logs to the control plane, along with making a few custom logfiles to catch any firewall and IPS logs in their own file. To ensure that we don’t overwhelm the control plane, we limit this to 100 logs a second (note that this number is arbitrary; the SRX supports up to 1,500 logs per second today, just for the sake of example).
root@srx3600n0# set system syslog file IPS any any

[edit]
root@srx3600n0# set system syslog file IPS match "IDP_ATTACK_LOG_EVENT"

[edit]
root@srx3600n0# set system syslog file FW any any

[edit]
root@srx3600n0# set system syslog file FW match "RT_FLOW"


[edit]
root@srx3600n0# show system syslog
file IPS {
    any any;
    match IDP_ATTACK_LOG_EVENT;
}
file FW {
    any any;
    match RT_FLOW;
}

[edit]
root@srx3600n0# show security log
mode event;
event-rate 100;
In this example, we defined mode Event and then defined two new
logfiles on the control plane that will match text for our respective
security facilities. We can then use the show
log IPS or show log FW
commands to view the contents of these files, including other pipe
facilities and the monitor start/stop command to tail the
files.
Note
If you are logging in Event mode to the control plane, you can
still send data plane logs to a syslog server, you just have to use
the standard control plane syslog facilities to do so. For instance,
you would configure logging in Event mode as shown in the previous
example, then under the set system
syslog stanza you can define a host to send logs to. This
can be all logs (including control plane logs) or you could write
filters to only send specific logs to specific hosts or files
locally. Although this isn’t the best option when it comes to
performance, if your logging rates are not high, it can provide an
alternative to logging all data plane logs out the data
plane.
There is one other important item to note: unless you are
configuring Event mode logging and sending the logs out the control
plane as we just described, if you want to log both the control
plane logs and the data plane logs to external syslog servers, this
does require the two configurations, one under set system syslog for the control plane
logs and one under set security
log for the data plane logs, even if they go to the same
destination. Because this causes the separation of the control plane
and data plane, there is just a bit more complexity.
Tips for Viewing Syslog Messages
Feeling lost in determining what logs you want to capture
or how they are formatted? The good news is that Juniper documents these
in the System Log Reference available with each version of Junos as well
as on the system itself. For instance, let’s say you want to learn more
about the log format for IPS attack logs, but you are not sure where
they exist or how they are formatted. We can use the help command to determine this formation.
root@srx3600n0> help syslog IDP?
Possible completions:
  <syslog-tag>         System log tag or regular expression
  IDP_APPDDOS_APP_ATTACK_EVENT  LOG_PFE,IDP: DDOS attack on application
  IDP_APPDDOS_APP_ATTACK_EVENT_LS  LOG_PFE,IDP: DDOS attack on application
  IDP_APPDDOS_APP_STATE_EVENT  LOG_PFE,IDP: DDOS application state transition event
  IDP_APPDDOS_APP_STATE_EVENT_LS  LOG_PFE,IDP: DDOS application state transition event
  IDP_ATTACK_LOG_EVENT_LS  LOG_PFE,IDP attack log
  IDP_COMMIT_COMPLETED  LOG_AUTH,IDP policy commit completed
  IDP_COMMIT_FAILED    LOG_AUTH,IDP commit exited with failure
  IDP_DAEMON_INIT_FAILED  LOG_AUTH,Failed to initialize IDP daemon
  IDP_IGNORED_IPV6_ADDRESSES  LOG_AUTH,IDP ingnores IPv6 addresses
  IDP_INTERNAL_ERROR   LOG_AUTH,IDP daemon encountered an internal error.
  IDP_POLICY_COMPILATION_FAILED  LOG_AUTH,IDP policy compilation failed
  IDP_POLICY_LOAD_FAILED  LOG_AUTH,Failed to load an IDP policy
  IDP_POLICY_LOAD_SUCCEEDED  LOG_AUTH,IDP policy loaded successfully
  IDP_POLICY_UNLOAD_FAILED  LOG_AUTH,Failed to unload an IDP policy
  IDP_POLICY_UNLOAD_SUCCEEDED  LOG_AUTH,IDP policy unloaded successfully
  IDP_SCHEDULEDUPDATE_START_FAILED  LOG_AUTH,Failed to start scheduled update
  IDP_SCHEDULED_UPDATE_STARTED  LOG_AUTH,Scheduled update has started
  IDP_SECURITY_INSTALL_RESULT  LOG_AUTH,IDP security package install result
  IDP_SESSION_LOG_EVENT  LOG_PFE,IDP session event log
  IDP_SESSION_LOG_EVENT_LS  LOG_PFE,IDP session event log
  IDP_SIGNATURE_LICENSE_EXPIRED  LOG_AUTH,IDP signature update license key has expired
root@srx3600n0> help syslog IDP_ATTACK_LOG_EVENT_LS
Name:          IDP_ATTACK_LOG_EVENT_LS
Message:       Lsys <logical-system-name>: IDP: At <epoch-time>, <message-type> Attack log <<source-address>/<source-port>-><destination-address>/<destination-port>> for <protocol-name> protocol and service
               <service-name> application <application-name> by rule <rule-name> of rulebase <rulebase-name> in policy <policy-name>. attack: repeat=<repeat-count>, action=<action>,
               threat-severity=<threat-severity>, name=<attack-name>, NAT <<nat-source-address>:<nat-source-port>-><nat-destination-address>:<nat-destination-port>>, time-elapsed=<elapsed-time>,
               inbytes=<inbound-bytes>, outbytes=<outbound-bytes>, inpackets=<inbound-packets>, outpackets=<outbound-packets>,
               intf:<source-zone-name>:<source-interface-name>-><destination-zone-name>:<destination-interface-name>, packet-log-id: <packet-log-id> and misc-message <message>
Help:          IDP attack log
Description:   IDP Attack log generated for attack
Type:          Event: This message reports an event, not an error
Severity:      info
Facility:      LOG_PFE
Here we can see all of the different types of logs, and if you drill into the logs, you can see the message format, which provides the template for the log messages that will be sent, along with some meta information about the log type that can be helpful. This is not at all limited to IDP; you can do this for any standard log message that Junos generates (meaning debug messages are typically not covered here).
JFlow on the SRX
The SRX platform supports exporting flow records in the JFlow format to an external flow collector like the STRM. JFlow provides sampled packets that can be analyzed by the flow collector. Although the traffic is sampled rather than sending every packet, it can still provide a great deal of visibility to the flow collector, and very advanced systems like STRM and Arbor Peakflow provide network intelligence based on the behaviors (and changes in behavior) seen in the network platform.
In this example, we configure JFlow to sample 1 in every 100 packets, up to 500 packets per second on interface xe-0/1/0. This will be exported to our STRM at 192.168.1.50 on UDP port 2055 (the standard JFlow port) using JFlow version 8.
[edit]
root@srx3600n0# set interfaces xe-0/1/0 unit 0 family inet sampling input

[edit]
root@srx3600n0# set interfaces xe-0/1/0 unit 0 family inet sampling output

[edit]
root@srx3600n0# set interfaces xe-0/1/0 unit 0 family inet address 192.168.2.1/24

 [edit]
root@srx3600n0# set forwarding-options sampling input ?
Possible completions:
+ apply-groups         Groups from which to inherit configuration data
+ apply-groups-except  Don't inherit configuration data from these groups
  max-packets-per-second  Threshold of samples per second before dropping
  maximum-packet-length  Maximum length of the sampled packet (0..9192 bytes)
  rate                 Ratio of packets to be sampled (1 out of N) (1..65535)
  run-length           Number of samples after initial trigger (0..20)

[edit]
root@srx3600n0# set forwarding-options sampling input rate 100

[edit]
root@srx3600n0# set forwarding-options sampling input max-packets-per-second 500

[edit]
root@srx3600n0# set forwarding-options sampling family inet output flow-server 192.168.1.50 ?
Possible completions:
  <[Enter]>            Execute this command
> aggregation          Aggregations to perform for exported flows (version 8 only)
+ apply-groups         Groups from which to inherit configuration data
+ apply-groups-except  Don't inherit configuration data from these groups
  autonomous-system-type  Type of autonomous system number to export
  local-dump           Dump cflowd records to log file before exporting
  no-local-dump        Don't dump cflowd records to log file before exporting
  port                 UDP port number on host collecting cflowd packets
  source-address       Source IPv4 address for cflowd packets
  version              Format of exported cflowd aggregates
  |                    Pipe through a command

[edit]
root@srx3600n0# set forwarding-options sampling family inet output flow-server 192.168.1.50 version ?
Possible completions:
  5                    Export cflowd aggregates in version 5 format
  500                  Export cflowd aggregates in ASN 500 format
  8                    Export cflowd aggregates in version 8 format

[edit]
root@srx3600n0# set forwarding-options sampling family inet output flow-server 192.168.1.50 version 8 port 2055


[edit]
root@srx3600n0# show interfaces xe-0/1/0
unit 0 {
    family inet {
        sampling {
            input;
            output;
        }
        address 192.168.2.1/24;
    }
}
[edit]
root@srx3600n0# show forwarding-options sampling
input {
    rate 100;
    max-packets-per-second 500;
}
family inet {
    output {
        flow-server 192.168.1.50 {
            port 2055;
            version 8;
        }
    }
}
Let’s break down this example a bit, as there are a lot of different configuration elements that are possible here. First, you need to enable flow sampling at an interface level. You can do so holistically, as we have, by enabling sampling in the input or output direction of the interface (ingress or egress, respectively, per interface). This will not distinguish any packets. If you want to selectively choose which packets to sample, that can be done with stateless firewall filters with the sample action.
Next, you need to define how many packets should be logged, and this is a very important detail. There are a few different options here, the first being the rate. This is calculated as 1:X where X is the rate that you define. If you selected a rate of 1 (1:1), then it would log every packet. This is a very bad idea! Ideally you should be sampling something much higher. The exact number depends on the needs of your flow collector, the amount of traffic passing through the device, and what you’re trying to accomplish. There are specialized platforms like Niksun if you need true line speed packet capture. The purpose of JFlow is to sample packets to give an approximation of network behavior rather than sample every packet. Next, to ensure that the system does not get overwhelmed (because a sample rate of even 1:100 can be high at, say, 10 Gbps, which would be 100 Mbps of sampled packets), you can define a maximum sampled PPS rate. Although we did not do it in this example, you can define the maximum packet size to sample (e.g., don’t sample jumbo frames by limiting the maximum packet size to 1,514 bytes) or to define how many packets to log for a flow before stopping.
Finally, you must define what you want to do with the collected packets. You can actually log them locally, log them both locally and to a server, or log them to just a server. Additionally, the SRX supports performing some aggregation. In most cases, you typically want to export the logs to a flow collection server like the STRM. You must define what the IP address and port is, and you can also define what version of JFlow to use [see NetFlow Wiki for more detail on the differences]. You can also define what source address the packets should be marked with, whether to log the information locally, and whether to tag the AS number in the data (if BGP is used).
Note
At the time of writing this book, the high-end SRX supports versions 5 and 8, and the branch SRX supports 5, 8, and 9. Keep posted with the release notes for changes in supported versions and feature support.
Best Practices
This chapter covers a wide range of topics for system services, so we will list a few of the best practices when it comes to configuring system services on the SRX.
It is really important to keep proper time on the SRX. The best way to do this is to leverage NTP. This is especially important on the high-end SRX, which relies on NTP to sync the individual SPCs to ensure a common clock, but is important for many other features and is generally a best practice.
Logging is a critical feature for any security administrator to perform. On the SRX, there are two logging systems: one on the control plane and one on the data plane. Both should be configured to log to an external system like an STRM, Security Intelligence, or third-party syslog receiver so that logs can be retained for historical purposes. Although the SRX can log both control plane and data plane logs locally to the control plane, this is not a best practice as it has more performance impact and the SRX is not designed to store information long term at high logging rates.
We discussed management services on the SRX. In most cases, it is ideal to support encrypted communication like SSH and HTTPS over Telnet and HTTP for security purposes. Additionally, it is always best to leverage fxp0 for out-of-band management wherever possible rather than in-band management on the data plane. There are a few reasons for this. First, if the data plane becomes unavailable due to a network incident or DoS attack, the control plane will still likely be available. Next, it allows you to configure a much more restrictive configuration on the data plane in terms of management, including disabling management services entirely.
SNMP is a very powerful tool for network administrators to glean important operational information from the SRX both from a polling and also from a trap perspective. There are numerous examples of both open source and commercial SNMP tools that can be leveraged to provide an advanced network infrastructure monitoring solution. Just be sure to lock SNMP down by only listening on interfaces like fxp0, using unusual community strings and access lists—and even SNMPv3 for encryption and authentication.
SNMP can seem like a large and complex feature to operate, but the good news is that there are some good ways to narrow down the scope of OIDs that you would like to monitor. Juniper documents all of the SNMP OID values, and additionally, you can leverage both the “enterprise” common values along with an SNMP MIB browser to parse through the SNMP MIB in an efficient manner. Additionally, you can leverage the built-in SNMP walk capabilities on the SRX to view the values locally.
JFlow allows you to sample packets and send them to an external JFlow collector. There is plenty of information that can be gleaned from sampled packets, particularly with a powerful network analysis tool like STRM. In conjunction with other tools like AppTrack and IPS, JFlow can provide a great deal of visibility into network activity and behaviors, particularly at a holistic level.
When using DHCP, you can leverage it as a client, server, and relay. In terms of best practices, you should only use DHCP where it is necessary, and not on every interface. DHCP should not be enabled when not in use at the security zone level.
Don’t forget about the Help facility in operational mode, which not only contains the documentation for each feature, but also allows you to search syslog messages and other suggestions for features so you need to look no further than the CLI to get help!
Troubleshooting and Operation
In this chapter, we covered several different system services features on the SRX. There are a few helpful systems that you can leverage when it comes to troubleshooting and operations on the SRX:
Viewing the System Connection Table
When troubleshooting to determine why a system isn’t
available, it can be helpful to view what connections the system is
listening for, along with what connections are active on the system
(bidirectional). This is exactly what the show
system connections command does. You can also use the |output
modifier to restrict what output you are looking for. The following is
an abridged list of connections on an SRX.
root@srx3600n0> show system connections
Active Internet connections (including servers)
Proto Recv-Q Send-Q  Local Address     Foreign Address      (state)
tcp4       0     52  172.19.100.49.22  172.23.4.189.54012   ESTABLISHED
tcp4       0      0  *.38              *.*                 LISTEN
tcp4       0      0  *.9000            *.*                 LISTEN
tcp4       0      0  *.33064           *.*                 LISTEN
tcp4       0      0  *.33040           *.*                 LISTEN
tcp4       0      0  *.6156            *.*                 LISTEN
tcp46      0      0  *.443             *.*                 LISTEN
tcp46      0      0  *.80              *.*                 LISTEN
tcp4       0      0  *.23              *.*                 LISTEN
tcp4       0      0  *.22              *.*                 LISTEN
tcp4       0      0  *.21              *.*                 LISTEN
tcp4       0      0  *.79              *.*                 LISTEN
tcp4       0      0  *.514             *.*                 LISTEN
tcp4       0      0  *.513             *.*                 LISTEN
tcp4       0      0  *.6234            *.*                 LISTEN
udp46      0      0  *.514             *.*
udp4       0      0  *.514             *.*
udp46      0      0  *.4500            *.*
udp4       0      0  *.4500            *.*
udp46      0      0  *.500             *.*
udp4       0      0  *.500             *.*
udp46      0      0  *.161             *.*
udp4       0      0  *.161             *.*
udp4       0      0  *.123             *.*
Viewing the Services/Counters on the Interface
It is useful to check service counters at the interface level to see if packets are getting filtered, particularly if there are any firewall filters or other service limiting features enabled:
root@srx3600n0> show interfaces xe-1/0/0 extensive
Physical interface: xe-1/0/0, Enabled, Physical link is Up
  Interface index: 148, SNMP ifIndex: 548, Generation: 166
  Description: EX4500 port xe-0/0/32
  Link-level type: Ethernet, MTU: 1514, LAN-PHY mode, Speed: 10Gbps, Loopback: None, Source filtering: Disabled, Flow control: Enabled
  Device flags   : Present Running
  Interface flags: SNMP-Traps Internal: 0x0
  Link flags     : None
  CoS queues     : 8 supported, 4 maximum usable queues
  Schedulers     : 0
  Hold-times     : Up 0 ms, Down 0 ms
  Current address: 00:21:59:8b:40:90, Hardware address: 00:21:59:8b:40:90
  Last flapped   : 2012-12-24 14:41:08 UTC (1w6d 04:29 ago)
  Statistics last cleared: Never
  Traffic statistics:
   Input  bytes  :         176878109672                    0 bps
   Output bytes  :         102563098568                    0 bps
   Input  packets:            263787865                    0 pps
   Output packets:            151357662                    0 pps
   IPv6 transit statistics:
    Input  bytes  :              389338
    Output bytes  :                   0
    Input  packets:                 462
    Output packets:                   0
  Dropped traffic statistics due to STP State:
   Input  bytes  :                    0
   Output bytes  :                    0
   Input  packets:                    0
   Output packets:                    0
  Input errors:
    Errors: 0, Drops: 0, Framing errors: 0, Runts: 0, Policed discards: 0, L3 incompletes: 0, L2 channel errors: 0, L2 mismatch timeouts: 0, FIFO errors: 0, Resource errors: 0
  Output errors:
    Carrier transitions: 1, Errors: 0, Drops: 0, Collisions: 0, Aged packets: 0, FIFO errors: 0, HS link CRC errors: 0, MTU errors: 0, Resource errors: 0
  Egress queues: 8 supported, 4 in use
  Queue counters:   Queued packets  Transmitted packets  Dropped packets
    0 best-effort        149062906            149062906                0
    1 expedited-fo               0                    0                0
    2 assured-forw               0                    0                0
    3 network-cont         2294745              2294745                0
  Queue number:       Mapped forwarding classes
    0                   best-effort
    1                   expedited-forwarding
    2                   assured-forwarding
    3                   network-control
  Active alarms  : None
  Active defects : None
  PCS statistics                      Seconds
    Bit errors                             0
    Errored blocks                         0
  MAC statistics:                      Receive         Transmit
    Total octets                  177933310938     103181618095
    Total packets                    263788085        151357662
    Unicast packets                  263559764        151033796
    Broadcast packets                    22721            79840
    Multicast packets                    50167           244026
    CRC/Align errors                         0                0
    FIFO errors                              0                0
    MAC control frames                       0                0
    MAC pause frames                         0                0
    Oversized frames                         0
    Jabber frames                            0
    Fragment frames                          0
    VLAN tagged frames                       0
    Code violations                          0
  Filter statistics:
    Input packet count               263788085
    Input packet rejects                   177
    Input DA rejects                         0
    Input SA rejects                         0
    Output packet count                               151357662
    Output packet pad count                                   0
    Output packet error count                                 0
    CAM destination filters: 0, CAM source filters: 0
  Packet Forwarding Engine configuration:
    Destination slot: 1
  CoS information:
    Direction : Output
    CoS transmit queue  Bandwidth        Buffer Priority   Limit
                              %            bps     %           usec
    0 best-effort            95     9500000000    95              0      low    none
    3 network-control         5      500000000     5              0      low    none
  Interface transmit statistics: Disabled

  Logical interface xe-1/0/0.0 (Index 70) (SNMP ifIndex 570) (Generation 138)
    Flags: SNMP-Traps 0x0 Encapsulation: ENET2
    Traffic statistics:
     Input  bytes  :         176878109672
     Output bytes  :         102399875752
     Input  packets:            263787865
     Output packets:            149451823
     IPv6 transit statistics:
      Input  bytes  :              389338
      Output bytes  :                   0
      Input  packets:                 462
      Output packets:                   0
    Local statistics:
     Input  bytes  :             15273660
     Output bytes  :             23415666
     Input  packets:                66227
     Output packets:               317127
    Transit statistics:
     Input  bytes  :                    0                    0 bps
     Output bytes  :                    0                    0 bps
     Input  packets:                    0                    0 pps
     Output packets:                    0                    0 pps
     IPv6 transit statistics:
      Input  bytes  :                   0
      Output bytes  :                   0
      Input  packets:                   0
      Output packets:                   0
    Security: Zone: trust
    Allowed host-inbound traffic : bootp bfd bgp dns dvmrp igmp ldp msdp nhrp ospf ospf3 pgm pim rip ripng router-discovery rsvp sap vrrp dhcp finger ftp tftp ident-reset http https ike netconf ping
    reverse-telnet reverse-ssh rlogin rpm rsh snmp snmp-trap ssh telnet traceroute xnm-clear-text xnm-ssl lsping ntp sip dhcpv6 r2cp
    Flow Statistics :
    Flow Input statistics :
      Self packets :                     21752
      ICMP packets :                     63516667
      VPN packets :                      0
      Multicast packets :                0
      Bytes permitted by policy :        127187179409
      Connections established :          75034327
    Flow Output statistics:
      Multicast packets :                0
      Bytes permitted by policy :        95604936318
    Flow error statistics (Packets dropped due to):
      Address spoofing:                  0
      Authentication failed:             0
      Incoming NAT errors:               0
      Invalid zone received packet:      0
      Multiple user authentications:     0
      Multiple incoming NAT:             0
      No parent for a gate:              0
      No one interested in self packets: 0
      No minor session:                  0
      No more sessions:                  0
      No NAT gate:                       0
      No route present:                  9950
      No SA for incoming SPI:            0
      No tunnel found:                   0
      No session for a gate:             0
      No zone or NULL zone binding       0
      Policy denied:                     0
      Security association not active:   0
      TCP sequence number out of window: 260192
      Syn-attack protection:             0
      User authentication errors:        0
    Protocol inet, MTU: 1500, Generation: 163, Route table: 0
      Flags: Sendbcast-pkt-to-re
      Addresses, Flags: Is-Preferred Is-Primary
        Destination: 10.102.1/24, Local: 10.102.1.1, Broadcast: 10.102.1.255, Generation: 160
    Input Filters: Inbound-QoS
    Output Filters: Outbound-QoS
      Addresses, Flags: Is-Preferred
        Destination: 10.102.3/24, Local: 10.102.3.1, Broadcast: 10.102.3.255, Generation: 162
    Protocol inet6, MTU: 1500, Generation: 164, Route table: 0
      Flags: Is-Primary
      Addresses, Flags: Is-Default Is-Preferred Is-Primary
        Destination: 2001::/120, Local: 2001::1
    Generation: 164
      Addresses, Flags: Is-Preferred
        Destination: fe80::/64, Local: fe80::221:59ff:fe8b:4090
    Protocol multiservice, MTU: Unlimited, Generation: 166
    Generation: 165, Route table: 0
      Policer: Input: __default_arp_policer__
Note
Don’t forget to check the lo0 interface when it comes to firewall filters, as that can be a reason why system services might be filtered along with being filtered at the interface level, at the security zone host-inbound-traffic level, and the security policy junos-host level. We cover the junos-host level in Chapter 8.
Also, if you configure the “count” action when configuring
stateless firewall filters, you can view how many hits are being
tagged by the SRX for that rule with the command show firewall counter <counter-name> filter
<filter-name>.
Checking NTP Status
When running NTP, it is often helpful to check the status
of the service along with what associations it currently has as a
client, server, or peer. You can do so with two commands: show ntp status and show ntp associations.
root@srx3600n0> show ntp status
status=0664 leap_none, sync_ntp, 6 events, event_peer/strat_chg,
version="ntpd 4.2.0-a Wed Nov 28 19:09:38 UTC 2012 (1)",
processor="powerpc", system="JUNOS11.4R6.5", leap=00, stratum=4,
precision=-18, rootdelay=185.795, rootdispersion=98.477, peer=19068,
refid=172.19.100.91,
reftime=d4944965.94c948f8  Sun, Jan  6 2013 19:05:09.581, poll=9,
clock=d4944e60.6e12d8ed  Sun, Jan  6 2013 19:26:24.429, state=4,
offset=-0.965, frequency=-0.618, jitter=0.627, stability=0.013

root@srx3600n0> show ntp associations
     remote           refid      st t when poll reach   delay   offset  jitter
==============================================================================
*172.19.100.91   178.78.255.254   3 -  255  512  377    0.187   −0.965   0.739
Checking SNMP Status
SNMP has numerous tools that can be used to view the
status and operation. We already covered the show snmp mib walk command earlier in the
chapter. Another helpful command is to check the SNMP statistics, which
include a lot of useful information about the number of messages sent
and received and other conditions that might have occurred.
root@srx3600n0> show snmp statistics
SNMP statistics:
  Input:
    Packets: 0, Bad versions: 0, Bad community names: 0,
    Bad community uses: 0, ASN parse errors: 0,
    Too bigs: 0, No such names: 0, Bad values: 0,
    Read onlys: 0, General errors: 0,
    Total request varbinds: 0, Total set varbinds: 0,
    Get requests: 0, Get nexts: 0, Set requests: 0,
    Get responses: 0, Traps: 0,
    Silent drops: 0, Proxy drops: 0, Commit pending drops: 0,
    Throttle drops: 0, Duplicate request drops: 0
  V3 Input:
    Unknown security models: 0, Invalid messages: 0
    Unknown pdu handlers: 0, Unavailable contexts: 0
    Unknown contexts: 0, Unsupported security levels: 0
    Not in time windows: 0, Unknown user names: 0
    Unknown engine ids: 0, Wrong digests: 0, Decryption errors: 0
  Output:
    Packets: 5126, Too bigs: 0, No such names: 0,
    Bad values: 0, General errors: 0,
    Get requests: 0, Get nexts: 0, Set requests: 0,
    Get responses: 0, Traps: 5126
DHCP Operational Mode Commands
There are several different relevant items that you can
leverage when it comes to operating DHCP. A big part of this has to do
with the fact that you can leverage DHCP as a client, server, and relay.
Most of these commands are available under the show system services dhcp operational mode
commands. You can check for items like the client to IP binding, any
conflicts seen, stats as a DHCP client and relay server, pool
configuration, and very helpful stats about the DHCP messages sent and
received on the system.
{primary:node0}
root@SRX100HM> show system services dhcp ?
Possible completions:
  binding              Show DHCP client binding information
  client               Show DHCP client information
  conflict             Show DHCP address conflict
  global               Show DHCP global scope information
  pool                 Show DHCP address pool information
  relay-statistics     Show DHCP relay statistics information
  statistics           Show DHCP statistics
{primary:node0}
root@SRX100HM> show system services dhcp binding
node0:
--------------------------------------------------------------
IP address       Hardware address   Type     Lease expires at
192.168.1.100  00:11:39:00:43:91  static   never

{primary:node0}
root@SRX100HM> show system services dhcp client
Logical Interface name         ge-0/0/1.0
        Hardware address        00:21:59:8b:40:01
        Client status           Active
        Address obtained        1.1.1.1
        Update server           disabled

{primary:node0}
root@SRX100HM> show system services dhcp pool
node0:
-----------------------------------------------------------------
Pool name           Low address      High address     Excluded addresses
192.168.1.0/24    192.168.1.100  192.168.1.200

{primary:node0}
root@SRX100HM> show system services dhcp statistics
node0:
-----------------------------------------------------------------
Packets dropped:
    Total                      3

Messages received:
    BOOTREQUEST                0
    DHCPDECLINE                0
    DHCPDISCOVER               5
    DHCPINFORM                 0
    DHCPRELEASE                1
    DHCPREQUEST                15

Messages sent:
    BOOTREPLY                  0
    DHCPOFFER                  15
    DHCPACK                    14
    DHCPNAK                    1
Viewing Security Logs Locally
If you are logging security event logs locally on the SRX,
you can view them in J-Web and the CLI by leveraging the show security log command along with the
appropriate modifier. The SRX provides a great number of options when it
comes to filtering these logs down. Of course, doing this externally on
a platform like the STRM is much better for historical purposes and
long-term approaches, whereas doing it locally can be helpful for small
deployments and simple troubleshooting.
{primary:node0}
root@SRX100HM> show security log ?
Possible completions:
  <[Enter]>            Execute this command
  ascending            Sort in ascending order
  descending           Sort in descending order
  destination-address  Destination address and optional prefix length
  destination-port     Destination port
  detail               Show detail alarm information
  event-id             Event ID filter
  failure              Event was a failure
  file                 Show security logs in binary format
  interface-name       Name of interface
  newer-than           Events newer than filter (YYYY-MM-DD.HH:MM:SS)
  older-than           Events older than filter (YYYY-MM-DD.HH:MM:SS)
  policy-name          Policy name filter
  process              Process that generated the event
  protocol             Protocol filter
  severity             Severity of the event
  sort-by              Sort by selected field
  source-address       Source address and optional prefix length
  source-port          Source port
  success              Event was successful
  username             Username filter
  |                    Pipe through a command
Checking for Core Dumps
When something goes wrong on the platform, the first thing that can be checked is whether there are any core dumps. For instance, if your IPS sigpack download were to fail, you might see a core dump from IDPD. If the data plane were to crash, there could be a flowd or chassisd core dump. Although you yourself cannot troubleshoot these, they can be given to the Juniper Networks Technical Assistance Center (JTAC) for analysis. Still, if you see a core dump, it can give some hints, including the potential need to restart a service.
root@srx3600n0> show system core-dumps
-rw-r--r--  1 root  wheel  1048630488 Dec 20 20:56 /var/crash/core-CPP0.core.0
-rw-rw----  1 nobody wheel 264597650 Dec 24 14:37 /var/tmp/flowd_xlr-SPC8_PIC0.core.0.gz
/var/tmp/pics/*core*: No such file or directory
/var/crash/kernel.*: No such file or directory
/tftpboot/corefiles/*core*: No such file or directory
total 2
This command is helpful because it checks all locations in which core dumps can be generated, along with running it on both members if running in HA. Here we can see that there were two different types of core dumps on December 20 and December 24. Although we don’t know exactly what the cause was, JTAC can usually get to the bottom of these.
Restarting Platform Daemons
From time to time you might run into a scenario where you
need to restart a service for one reason or another. The good news is
that you don’t need to restart the entire platform in most cases; you
can just restart individual services with the restart <service> command. In this
example, we restart the IPS policy, which will trigger a policy
recompile and have the system push the policy to the data plane. We will
run the show system processes extensive | match
idpd command to check and see the process number before and
after we do the restart.
root@srx3600n0> show system processes extensive | match idpd
 1184 root        1  96    0 32200K 20328K select  15:14  0.00% idpd

root@srx3600n0> restart idp-policy
IDP policy daemon started, pid 28506

root@srx3600n0> show system processes extensive | match idpd
28506 root        1 132    0   108M 77132K RUN      0:04 76.30% idpd

root@srx3600n0> restart ?
Possible completions:
  application-identification  Application-identification process
  application-security  Application security daemon
  audit-process        Audit process
  chassis-control      Chassis control process
  class-of-service     Class-of-service process
  database-replication  Database Replication process
  datapath-trace-service  DATAPATH Trace process
  dhcp                 Dynamic Host Configuration Protocol process
  dhcp-service         Dynamic Host Configuration Protocol process
  disk-monitoring      Disk monitoring process
  dynamic-flow-capture  Dynamic flow capture service
  ethernet-connectivity-fault-management  Connectivity fault management process
  event-processing     Event processing process
  fipsd                FIPS daemon
  firewall             Firewall process
  firewall-authentication-service  Firewall authentication daemon
  general-authentication-service  General authentication process
  gprs-process         gprs daemon
  gracefully           Gracefully restart the process
  idp-policy           IDP policy daemon
  immediately          Immediately restart (SIGKILL) the process
  interface-control    Interface control process
  ipmi                 Intelligent platform management interface daemon
  ipsec-key-management  IPSec Key Management daemon
  jsrp-service         Juniper Stateful Redundancy Protocol Daemon
  kernel-replication   Kernel replication process
  l2-learning          Layer 2 address flooding and learning process
  l2cpd-service        Layer 2 Control Protocol process
  lacp                 Link Aggregation Control Protocol process
  license-service      Feature license management process
  logical-system-service  Logical System Daemon
  mib-process          Management Information Base II process
  mountd-service       Service for NFS mounts requests
  named-service        DNS server process
  network-security     Network security daemon
  network-security-trace  Network security trace daemon
  nfsd-service         Remote NFS server
  ntpd-service         Network Time Protocol Service
  pgm                  Pragmatic General Multicast process
  pic-services-logging  PIC services logging process
  pki-service          PKI service daemon
  profilerd            Profiler Daemon
  remote-operations    Remote operations process
  routing              Routing protocol process
  sampling             Traffic sampling control process
  secure-neighbor-discovery  Secure Neighbor Discovery Protocol process
  security-log         Security Log Daemon
  service-deployment   Service Deployment Client
  simple-mail-client-service  Simple Mail Transfer Protocol Client process
  snmp                 Simple Network Management Protocol process
  soft                 Soft reset (SIGHUP) the process
  statistics-service   Packet Forwarding Engine statistics management process
  subscriber-management  Subscriber management process
  subscriber-management-helper  Subscriber management helper process
  tunnel-oamd          Tunnel OAM process
  uac-service          Unified access control daemon
  vrrp                 Virtual Router Redundancy Protocol process
  web-management       Web management process
Troubleshooting Individual Daemons
Most system daemons have the ability to be debugged beyond the normal stats and show commands by leveraging traceoptions. Because there are so many different daemons and the traceoptions vary from subsystem to subsystem, we are not going to cover them extensively, but we want to point out that you might be able to leverage the traceoptions if need be. Typically, it is a better idea to just contact JTAC if you are unsure of what you’re doing, but if you are confident, you might be able to troubleshoot a simple issue yourself by activating a traceoption and viewing the output.
Most system traceoptions are done on a feature-by-feature basis. You need to activate the traceoption, define what file to log to, define what flags you want to activate, and then commit the configuration for the trace to take effect. You can then view the output in the logfile you specified, followed by deactivating, deleting, or rolling back your configuration so that the traceoptions is no longer active. It is typically best to only use traceoptions for the precise time that they are needed. This ensures that additional system resources aren’t consumed unnecessarily. The following are a few examples of enabling system traceoptions.
[edit]
root@srx3600n0# set snmp traceoptions ?
Possible completions:
+ apply-groups         Groups from which to inherit configuration data
+ apply-groups-except  Don't inherit configuration data from these groups
> file                 Trace file information
> flag                 Tracing parameters
  no-remote-trace      Disable remote tracing

[edit]
root@srx3600n0# set system services dhcp traceoptions ?
Possible completions:
+ apply-groups         Groups from which to inherit configuration data
+ apply-groups-except  Don't inherit configuration data from these groups
> file                 Trace file information
> flag                 Area of DHCP server process to enable debugging output
  level                Level of debugging output
  no-remote-trace      Disable remote tracing

[edit]
root@srx3600n0# set security log traceoptions ?
Possible completions:
+ apply-groups         Groups from which to inherit configuration data
+ apply-groups-except  Don't inherit configuration data from these groups
> file                 Trace file information
> flag                 List of things to include in trace
  no-remote-trace      Disable remote tracing
Summary
The SRX is a very powerful platform and we could spend an entire book covering all of the different system services and their configuration options. Instead we choose to focus on the most common ones with the most important configuration values so you can get a system up and running properly. Regardless of how the SRX is deployed, whether it be for a service provider environment or in a branch perimeter deployment on an SRX100, the SRX can offer a great deal of functionality via the system services that have been born and bred from the Internet core. Although not the most obvious topic to focus on when configuring the SRX, properly configuring the system services can alleviate a lot of heartache later and maximize the functionality of your deployment.
Study Questions
- Questions
How do you manually set the system time on the SRX?
What are the different NTP modes the SRX supports?
What are the three DHCP modes that the SRX supports and what do they do?
What is unique about DHCP from a security zone configuration perspective on the SRX?
Explain the difference between control plane and data plane logging on the SRX.
What is JFlow?
What is the difference between an SNMP query and an SNMP trap?
What is the best interface to use for network management on the SRX?
How can you view the format of system log messages locally on the SRX without having to refer to online manuals?
What formats can you use to send syslog messages on the control plane and data plane to syslog collectors?
- Answers
You can manually set the system time by using the operational mode command
set
                date
because this is a real-time parameter rather than a configuration mode element.The SRX can provide NTP client, server, and peer functionality. As a client it receives its configuration from an NTP server, as a server it provides NTP functionality to clients that request it or receive it via broadcast configuration, and as a peer the SRX and NTP peer sync each other’s time.
The SRX can act as a DHCP client, server, and relay. As a client, it receives its DHCP configuration from an upstream DHCP server; as a server, it distributes the DHCP information to clients; and as a relay, it takes local DHCP broadcast requests and forwards them on to the DHCP server, which exists on a different Layer 3 segment.
DHCP is the only service that can be configured only under an interface in the host-inbound traffic configuration within a security zone configuration rather than at the zone level.
Control plane logging on the SRX is for messages that are generated on the control plane. They can be stored to files or sent out via syslog to external hosts. Typically these are generated by control plane daemons and are logged to /var/log under the respective files for that daemon or traceoption configuration. Data plane logs are generated based on traffic that passes through the SRX such as firewall logs, IPS logs, UTM logs, and so on. These can be sent directly out the data plane or logged up to the control plane where they can either be stored locally or sent to a syslog server. Logging data plane logs out the data plane directly is typically the best option from a performance perspective to ensure that the control plane isn’t overwhelmed by the rate of data plane messages.
JFlow is similar to Cisco’s NetFlow and provides the ability to sample packets to an external flow collector, which can receive them and analyze them accordingly. JFlow is an excellent tool for network analysis at a higher level to identify trends and network behaviors.
An SNMP query is polled from an SNMP collector to a system like the SRX. It specifies an index value known as an OID to retrieve and respond back to the query agent. An SNMP trap, on the other hand, is generated on the SRX and sent to an SNMP collector. Typically, this contains information about a system event or condition defined by the network administrator.
Typically, fxp0, which is the out-of-band control plane interface, is the best interface to use on the SRX, if possible. This is because it does not need to rely on the data plane availability and can be put on its own private network for ideal out-of-band management versus the transit traffic on the network.
You can leverage the operational mode
help syslogcommand to view the log messages, formats, and examples for each subsystem. Additionally, the help function contains other documentation information that can be valuable to operators on the SRX and in Junos in general.The SRX control plane supports both unstructured (standard) and structured syslog, whereas the data plane supports sending messages in unstructured (standard), structured, binary, and WELF format.
Get Juniper SRX Series now with the O’Reilly learning platform.
O’Reilly members experience books, live events, courses curated by job role, and more from O’Reilly and nearly 200 top publishers.

