Chapter 4. Routing Engine Protection and DDoS Prevention
This chapter builds upon the last by providing a concrete example of stateless firewall filter and policer usage in the context of a Routing Engine protection filter, and also demonstrates the new Trio-specific DDoS prevention feature that hardens the already robust Junos control plane with no explicit configuration required.
The RE protection topics discussed include:
IPv4 and IPv6 control plane protection filter case study
DDoS feature overview
DDoS protection case study
Mitigating DDoS with BGP flow specification
BGP flow-specification case study
RE Protection Case Study
This case study presents a current best practice example of a stateless filter to protect an MX router’s IPv4 and IPv6 control plane. In addition, the DDoS detection feature, available on Trio-based MX routers starting with release v11.2, is examined and then combined with RE filtering to harden the router against unauthorized access and resource depletion.
As networks become more critical, security and high availability become ever more crucial. The need for secure access to network infrastructure, both in terms of user-level authentication and authorization and all the way to the configuration and use of secure access protocols like SSH, is a given. So much so that these topics have been covered in many recent books. So as to not rehash the same information, readers interested in these topics are directed to Junos Enterprise Routing, Second Edition, by O’Reilly Media.
The goal of this section is to provide an up-to-date example of a strong RE protection filter for both IPv4 and IPv6, and to address the topic of why basic filters may not guard against resource depletion, which, if allowed to go unchecked, can halt a router’s operation just as effectively as any “hacker” who gains unauthorized access to the system with nefarious intent.
The topic of router security is complex and widespread. So much so that informational RFC 6192 was produced to outline IPv4 and IPv6 filtering best practices, along with example filters for both IOS- and Junos OS-based products. There is much overlap between the examples in this section and the RFC’s suggestions, which is a good sign, as you can never have too many smart people thinking about security. It’s good to see different approaches and techniques as well as a confirmation that many complex problems have common solutions that have been well tested.
IPv4 RE Protection Filter
This section provides the reader with a current best practice example of an RE protection filter for IPv4 traffic. Protection filters are applied in the input direction to filter traffic arriving on PFE or management ports before it’s processed by the RE. Output filters are generally used for CoS marking of locally generated control plane traffic, as opposed to security-related reasons, as you generally trust your own routers and the traffic they originate. Figure 4-1 provides the topology details that surround this case study.
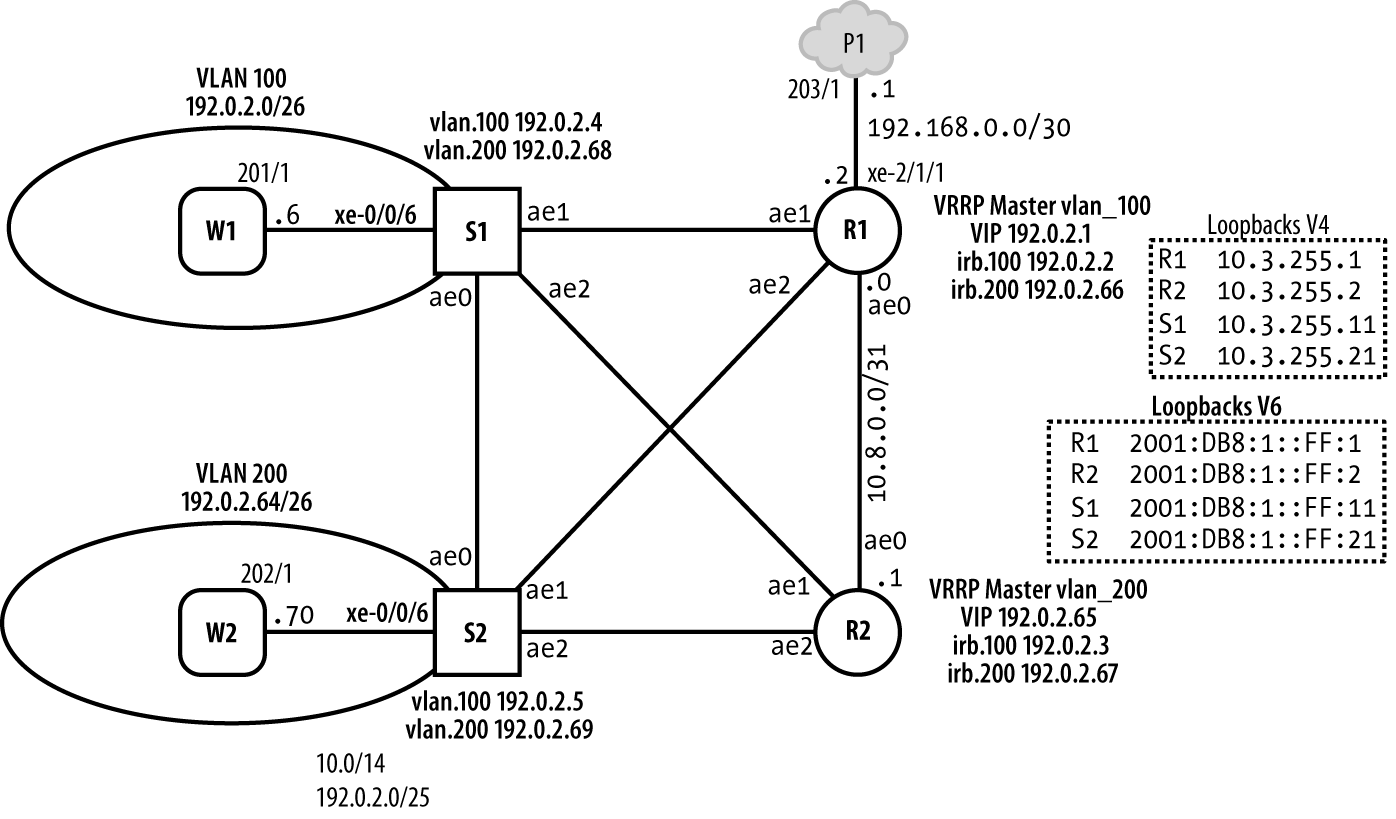
Figure 4-1. DDoS protection lab topology
The example, used with permission from Juniper Networks Books, is taken from Day One: Securing the Routing Engine by Douglas Hanks, also coauthor of this book.
Warning
Note: Router security is no small matter. The reader is encouraged to examine the filter carefully before adapting it for use in his or her own network.
The principles behind the filter’s operation and the specific rationale behind its design framework are explained in the Day One book, and so are not repeated here in the interest of brevity. The filter is included here as a case study example for several reasons:
RE protection is important and needed, and this is a really good filter. There’s no point in recreating an already perfectly round wheel, and the Day One book is freely available as a PDF.
The example makes great use of some important Junos features that are not necessarily MX-specific, and so have not been covered in this chapter, including filter nesting (a filter calling another filter),
apply-path, andprefix-list. All are powerful tools that can make managing and understanding a complex filter much simpler. The examples also make use of theapply-flags omitstatement. This flag results in the related configuration block not being displayed in ashow configuration command, unless you pipe the results todisplay omit. Again, while not a filter-specific feature, this is another cool Junos capability that can be utilized to make living with long filters that much easier.It’s a good test of this chapter and the reader’s comprehension of the same. This is a real-world example of a complex filter that solves a real issue. While specific protocol nuances, such as the specific multicast addresses used by OSPF, may not be known, having arrived here, the reader should be able to follow the filter’s operation and use of policing with little guidance.
The example is comprehensive, providing support for virtually all known legitimate routing protocols and services; be sure to remove support for any protocols or services that are not currently used, either by deleting the filter in question or by simply not including that filter in the list of filters that you ultimately apply to the lo0 interface. For example, as IS-IS is used in the current lab, there is currently no need for any OSPF-specific filter. Also, be sure to confirm that the prefix lists contain all addresses that should be able to reach the related service or protocol.
When first applying the filter list, you should replace the final discard-all term with one that matches all with an accept and log action. This is done as a safeguard to prevent service disruption in the event that a valid service or protocol has not been accommodated by a previous term. After applying the filter, pay special attention to any log hits indicating traffic has made it to the final catch-all term, as this may indicate you have more filter work to do.
Warning
Before applying any RE filter, you should carefully evaluate both the filters/terms and their application order to confirm that all valid services and remote access methods are allowed. In addition, you must also edit the sample prefix list to ensure they accurately reflect all internal and external addresses from where the related services should be reachable. Whenever making this type of change, console access should be available in the event that recovery is needed, and you should strongly consider the use of the commit confirmed command.
When your filter is correctly matched to the particulars of your network, the only traffic that should fall through to the final term should be that which is unsupported and therefore unneeded, and safe to drop. Once it is so confirmed, you should make the discard-all filter the last in the chain—its ongoing count and logging actions simplify future troubleshooting when a new service is added and no one can figure out why it’s not working. Yes, true security is a pain, but far less so in the long run then the lack of, or worse yet, a false sense of security!
Let’s begin with the policy-related configuration where prefix lists are defined in such a way that they automatically populate with addresses assigned to the system itself, as well as well-known addresses associated with common protocols. This small bit of upfront work makes later address-based matches a snap and helps ensure that ongoing address and peer definition changes are painless, as the filter automatically keeps up. Note that the sample expressions catch all addresses assigned, including those on the management network and GRE tunnels, etc. The sample presumes some use of logical systems (a feature previously known as logical routers). Where not applicable you can safely omit the related prefix list.
{master}[edit]
user1@R1-RE0# show policy-options | no-more
prefix-list router-ipv4 {
    apply-path "interfaces <*> unit <*> family inet address <*>";
}
prefix-list bgp-neighbors {
    apply-path "protocols bgp group <*> neighbor <*>";
}
prefix-list ospf {
    224.0.0.5/32;
    224.0.0.6/32;
}
prefix-list rfc1918 {
    10.0.0.0/8;
    172.16.0.0/12;
    192.168.0.0/16;
}
prefix-list rip {
    224.0.0.9/32;
}
prefix-list vrrp {
    224.0.0.18/32;
}
prefix-list multicast-all-routers {
    224.0.0.2/32;
}
prefix-list router-ipv4-logical-systems   {
    apply-path "logical-systems <*> interfaces <*> unit <*> family inet address
    <*>";
}
prefix-list bgp-neighbors-logical-systems {
    apply-path "logical-systems <*> protocols bgp group <*> neighbor <*>";
}
prefix-list radius-servers {
    apply-path "system radius-server <*>";
}
prefix-list tacas-servers {
    apply-path "system tacplus-server <*>";
}
prefix-list ntp-server {
    apply-path "system ntp server <*>";
}
prefix-list snmp-client-lists {
    apply-path "snmp client-list <*> <*>";
}
prefix-list snmp-community-clients {
    apply-path "snmp community <*> clients <*>";
}
prefix-list localhost {
    127.0.0.1/32;
}
prefix-list ntp-server-peers {
    apply-path "system ntp peer <*>";
}
prefix-list dns-servers {
    apply-path "system name-server <*>";
}
You can confirm your apply-path and prefix lists are doing what you expect by showing the list and piping the output to display inheritance. Again, it’s critical that your prefix lists contain all expected addresses from where a service should be reachable, so spending some time here to confirm the regular expressions work as expected is time well spent. Here, the results of the router-ipv4 apply-path regular expression are examined.
{master}[edit]
jnpr@R1-RE0# show policy-options prefix-list router-ipv4
apply-path "interfaces <*> unit <*> family inet address <*>";

{master}[edit]
jnpr@R1-RE0# show policy-options prefix-list router-ipv4 | display inheritance
##
## apply-path was expanded to:
##     192.168.0.0/30;
##     10.8.0.0/31;
##     192.0.2.0/26;
##     192.0.2.64/26;
##     10.3.255.1/32;
##     172.19.90.0/23;
##
apply-path "interfaces <*> unit <*> family inet address <*>";
If you do not see one or more commented prefixes, as in this example, then either the related configuration does not exist or there is a problem in your path statement. As additional confirmation, consider the sample BGP stanza added to R1, consisting of three BGP peer groups: two IPv6 and one IPv4:
{master}[edit]
jnpr@R1-RE0# show protocols bgp
group int_v4 {
    type internal;
    local-address 10.3.255.1;
    neighbor 10.3.255.2;
}
group ebgp_v6 {
    type external;
    peer-as 65010;
    neighbor fd1e:63ba:e9dc:1::1;
}
group int_v6 {
    type internal;
    local-address 2001:db8:1::ff:1;
    neighbor 2001:db8:1::ff:2;
}
Once again, the related prefix lists are confirmed to contain all expected entries:
{master}[edit]
jnpr@R1-RE0# show policy-options prefix-list bgp-neighbors_v4 | display
inheritance
##
## apply-path was expanded to:
##     10.3.255.2/32;
##
apply-path "protocols bgp group <*_v4> neighbor <*>";

{master}[edit]
jnpr@R1-RE0# show policy-options prefix-list bgp-neighbors_v6 | display
inheritance
##
## apply-path was expanded to:
##     fd1e:63ba:e9dc:1::1/128;
##     2001:db8:1::ff:2/128;
##
apply-path "protocols bgp group <*_v6> neighbor <*>";
And now, the actual filter. It’s a long one, but security is never easy and is more an ongoing process than a one-point solution anyway. At least the comprehensive nature of the filter means it’s easy to grow into new services or protocols as you simply have to apply the related filters when the new service is turned up:
{master}[edit]
jnpr@R1-RE0# show firewall family inet | no-more
prefix-action management-police-set { /* OMITTED */ };
prefix-action management-high-police-set { /* OMITTED */ };
filter accept-bgp { /* OMITTED */ };
filter accept-ospf { /* OMITTED */ };
filter accept-rip { /* OMITTED */ };
filter accept-vrrp { /* OMITTED */ };
filter accept-ssh { /* OMITTED */ };
filter accept-snmp { /* OMITTED */ };
filter accept-ntp { /* OMITTED */ };
filter accept-web { /* OMITTED */ };
filter discard-all { /* OMITTED */ };
filter accept-traceroute { /* OMITTED */ };
filter accept-igp { /* OMITTED */ };
filter accept-common-services { /* OMITTED */ };
filter accept-sh-bfd { /* OMITTED */ };
filter accept-ldp { /* OMITTED */ };
filter accept-ftp { /* OMITTED */ };
filter accept-rsvp { /* OMITTED */ };
filter accept-radius { /* OMITTED */ };
filter accept-tacas { /* OMITTED */ };
filter accept-remote-auth { /* OMITTED */ };
filter accept-telnet { /* OMITTED */ };
filter accept-dns { /* OMITTED */ };
filter accept-ldp-rsvp { /* OMITTED */ };
filter accept-established { /* OMITTED */ };
filter accept-all { /* OMITTED */ };
filter accept-icmp { /* OMITTED */ };
filter discard-frags { /* OMITTED */ };
Not much to see, given the omit flag is in play. Easy enough to fix:
{master}[edit]
jnpr@R1-RE0# show firewall family inet | no-more | display omit
prefix-action management-police-set {
apply-flags omit;
policer management-1m;
count;
filter-specific;
subnet-prefix-length 24;
destination-prefix-length 32;
}
prefix-action management-high-police-set {
apply-flags omit;
policer management-5m;
count;
filter-specific;
subnet-prefix-length 24;
destination-prefix-length 32;
}
filter accept-bgp {
apply-flags omit;
term accept-bgp {
from {
source-prefix-list {
bgp-neighbors_v4;
bgp-neighbors-logical-systems_v4;
}
protocol tcp;
port bgp;
}
then {
count accept-bgp;
accept;
}
}
}
filter accept-ospf {
apply-flags omit;
term accept-ospf {
from {
source-prefix-list {
router-ipv4;
router-ipv4-logical-systems ;
}
destination-prefix-list {
router-ipv4;
ospf;
router-ipv4-logical-systems ;
}
protocol ospf;
}
then {
count accept-ospf;
accept;
}
}
}
filter accept-rip {
apply-flags omit;
term accept-rip {
from {
source-prefix-list {
router-ipv4;
router-ipv4-logical-systems ;
}
destination-prefix-list {
rip;
}
protocol udp;
destination-port rip;
}
then {
count accept-rip;
accept;
}
}
term accept-rip-igmp {
from {
source-prefix-list {
router-ipv4;
router-ipv4-logical-systems ;
}
destination-prefix-list {
rip;
}
protocol igmp;
}
then {
count accept-rip-igmp;
accept;
}
}
}
filter accept-vrrp {
apply-flags omit;
term accept-vrrp {
from {
source-prefix-list {
router-ipv4;
router-ipv4-logical-systems ;
}
destination-prefix-list {
vrrp;
}
protocol [ vrrp ah ];
}
then {
count accept-vrrp;
accept;
}
}
}
filter accept-ssh {
apply-flags omit;
term accept-ssh {
from {
source-prefix-list {
rfc1918;
}
destination-prefix-list {
router-ipv4;
router-ipv4-logical-systems ;
}
protocol tcp;
destination-port ssh;
}
then {
policer management-5m;
count accept-ssh;
accept;
}
}
}
filter accept-snmp {
apply-flags omit;
term accept-snmp {
from {
source-prefix-list {
snmp-client-lists;
snmp-community-clients;
}
destination-prefix-list {
router-ipv4;
router-ipv4-logical-systems ;
}
protocol udp;
destination-port snmp;
}
then {
policer management-5m;
count accept-snmp;
accept;
}
}
}
filter accept-ntp {
apply-flags omit;
term accept-ntp {
from {
source-prefix-list {
ntp-server;
}
destination-prefix-list {
router-ipv4;
router-ipv4-logical-systems ;
}
protocol udp;
port ntp;
}
then {
policer management-1m;
count accept-ntp;
accept;
}
}
term accept-ntp-peer {
from {
source-prefix-list {
ntp-server-peers;
}
destination-prefix-list {
router-ipv4;
router-ipv4-logical-systems ;
}
protocol udp;
destination-port ntp;
}
then {
policer management-1m;
count accept-ntp-peer;
accept;
}
}
term accept-ntp-server {
from {
source-prefix-list {
rfc1918;
}
destination-prefix-list {
router-ipv4;
router-ipv4-logical-systems ;
}
protocol udp;
destination-port ntp;
}
then {
policer management-1m;
count accept-ntp-server;
accept;
}
}
}
filter accept-web {
apply-flags omit;
term accept-web {
from {
source-prefix-list {
rfc1918;
}
destination-prefix-list {
router-ipv4;
router-ipv4-logical-systems ;
}
protocol tcp;
destination-port [ http https ];
}
then {
policer management-5m;
count accept-web;
accept;
}
}
}
filter discard-all {
apply-flags omit;
term discard-ip-options {
from {
ip-options any;
}
then {
count discard-ip-options;
log;
syslog;
discard;
}
}
term discard-TTL_1-unknown {
from {
ttl 1;
}
then {
count discard-all-TTL_1-unknown;
log;
syslog;
discard;
}
}
term discard-tcp {
from {
protocol tcp;
}
then {
count discard-tcp;
log;
syslog;
discard;
}
}
term discard-netbios {
from {
protocol udp;
destination-port 137;
}
then {
count discard-netbios;
log;
syslog;
discard;
}
}
term discard-udp {
from {
protocol udp;
}
then {
count discard-udp;
log;
syslog;
discard;
}
}
term discard-icmp {
from {
protocol icmp;
}
then {
count discard-icmp;
log;
syslog;
discard;
}
}
term discard-unknown {
then {
count discard-unknown;
log;
syslog;
discard;
}
}
}
filter accept-traceroute {
apply-flags omit;
term accept-traceroute-udp {
from {
destination-prefix-list {
router-ipv4;
router-ipv4-logical-systems ;
}
protocol udp;
ttl 1;
destination-port 33435-33450;
}
then {
policer management-1m;
count accept-traceroute-udp;
accept;
}
}
term accept-traceroute-icmp {
from {
destination-prefix-list {
router-ipv4;
router-ipv4-logical-systems ;
}
protocol icmp;
ttl 1;
icmp-type [ echo-request timestamp time-exceeded ];
}
then {
policer management-1m;
count accept-traceroute-icmp;
accept;
}
}
term accept-traceroute-tcp {
from {
destination-prefix-list {
router-ipv4;
router-ipv4-logical-systems ;
}
protocol tcp;
ttl 1;
}
then {
policer management-1m;
count accept-traceroute-tcp;
accept;
}
}
}
filter accept-igp {
apply-flags omit;
term accept-ospf {
filter accept-ospf;
}
term accept-rip {
filter accept-rip;
}
}
filter accept-common-services {
apply-flags omit;
term accept-icmp {
filter accept-icmp;
}
term accept-traceroute {
filter accept-traceroute;
}
term accept-ssh {
filter accept-ssh;
}
term accept-snmp {
filter accept-snmp;
}
term accept-ntp {
filter accept-ntp;
}
term accept-web {
filter accept-web;
}
term accept-dns {
filter accept-dns;
}
}
filter accept-sh-bfd {
apply-flags omit;
term accept-sh-bfd {
from {
source-prefix-list {
router-ipv4;
router-ipv4-logical-systems ;
}
destination-prefix-list {
router-ipv4;
router-ipv4-logical-systems ;
}
protocol udp;
source-port 49152-65535;
destination-port 3784-3785;
}
then {
count accept-sh-bfd;
accept;
}
}
}
filter accept-ldp {
apply-flags omit;
term accept-ldp-discover {
from {
source-prefix-list {
router-ipv4;
router-ipv4-logical-systems ;
}
destination-prefix-list {
multicast-all-routers;
}
protocol udp;
destination-port ldp;
}
then {
count accept-ldp-discover;
accept;
}
}
term accept-ldp-unicast {
from {
source-prefix-list {
router-ipv4;
router-ipv4-logical-systems ;
}
destination-prefix-list {
router-ipv4;
router-ipv4-logical-systems ;
}
protocol tcp;
port ldp;
}
then {
count accept-ldp-unicast;
accept;
}
}
term accept-tldp-discover {
from {
destination-prefix-list {
router-ipv4;
router-ipv4-logical-systems ;
}
protocol udp;
destination-port ldp;
}
then {
count accept-tldp-discover;
accept;
}
}
term accept-ldp-igmp {
from {
source-prefix-list {
router-ipv4;
router-ipv4-logical-systems ;
}
destination-prefix-list {
multicast-all-routers;
}
protocol igmp;
}
then {
count accept-ldp-igmp;
accept;
}
}
}
filter accept-ftp {
apply-flags omit;
term accept-ftp {
from {
source-prefix-list {
rfc1918;
}
destination-prefix-list {
router-ipv4;
router-ipv4-logical-systems ;
}
protocol tcp;
port [ ftp ftp-data ];
}
then {
policer management-5m;
count accept-ftp;
accept;
}
}
}
filter accept-rsvp {
apply-flags omit;
term accept-rsvp {
from {
destination-prefix-list {
router-ipv4;
router-ipv4-logical-systems ;
}
protocol rsvp;
}
then {
count accept-rsvp;
accept;
}
}
}
filter accept-radius {
apply-flags omit;
term accept-radius {
from {
source-prefix-list {
radius-servers;
}
destination-prefix-list {
router-ipv4;
router-ipv4-logical-systems ;
}
protocol udp;
source-port [ radacct radius ];
tcp-established;
}
then {
policer management-1m;
count accept-radius;
accept;
}
}
}
filter accept-tacas {
apply-flags omit;
term accept-tacas {
from {
source-prefix-list {
tacas-servers;
}
destination-prefix-list {
router-ipv4;
router-ipv4-logical-systems ;
}
protocol [ tcp udp ];
source-port [ tacacs tacacs-ds ];
tcp-established;
}
then {
policer management-1m;
count accept-tacas;
accept;
}
}
}
filter accept-remote-auth {
apply-flags omit;
term accept-radius {
filter accept-radius;
}
term accept-tacas {
filter accept-tacas;
}
}
filter accept-telnet {
apply-flags omit;
term accept-telnet {
from {
source-prefix-list {
rfc1918;
}
destination-prefix-list {
router-ipv4;
router-ipv4-logical-systems ;
}
protocol tcp;
destination-port telnet;
}
then {
policer management-1m;
count accept-telnet;
accept;
}
}
}
filter accept-dns {
apply-flags omit;
term accept-dns {
from {
source-prefix-list {
dns-servers;
}
destination-prefix-list {
router-ipv4;
router-ipv4-logical-systems ;
}
protocol [ udp tcp ];
source-port 53;
}
then {
policer management-1m;
count accept-dns;
accept;
}
}
}
filter accept-ldp-rsvp {
apply-flags omit;
term accept-ldp {
filter accept-ldp;
}
term accept-rsvp {
filter accept-rsvp;
}
}
filter accept-established {
apply-flags omit;
term accept-established-tcp-ssh {
from {
destination-prefix-list {
router-ipv4;
router-ipv4-logical-systems ;
}
source-port ssh;
tcp-established;
}
then {
policer management-5m;
count accept-established-tcp-ssh;
accept;
}
}
term accept-established-tcp-ftp {
from {
destination-prefix-list {
router-ipv4;
router-ipv4-logical-systems ;
}
source-port ftp;
tcp-established;
}
then {
policer management-5m;
count accept-established-tcp-ftp;
accept;
}
}
term accept-established-tcp-ftp-data-syn {
from {
destination-prefix-list {
router-ipv4;
router-ipv4-logical-systems ;
}
source-port ftp-data;
tcp-initial;
}
then {
policer management-5m;
count accept-established-tcp-ftp-data-syn;
accept;
}
}
term accept-established-tcp-ftp-data {
from {
destination-prefix-list {
router-ipv4;
router-ipv4-logical-systems ;
}
source-port ftp-data;
tcp-established;
}
then {
policer management-5m;
count accept-established-tcp-ftp-data;
accept;
}
}
term accept-established-tcp-telnet {
from {
destination-prefix-list {
router-ipv4;
router-ipv4-logical-systems ;
}
source-port telnet;
tcp-established;
}
then {
policer management-5m;
count accept-established-tcp-telnet;
accept;
}
}
term accept-established-tcp-fetch {
from {
destination-prefix-list {
router-ipv4;
router-ipv4-logical-systems ;
}
source-port [ http https ];
tcp-established;
}
then {
policer management-5m;
count accept-established-tcp-fetch;
accept;
}
}
term accept-established-udp-ephemeral {
from {
destination-prefix-list {
router-ipv4;
router-ipv4-logical-systems ;
}
protocol udp;
destination-port 49152-65535;
}
then {
policer management-5m;
count accept-established-udp-ephemeral;
accept;
}
}
}
filter accept-all {
apply-flags omit;
term accept-all-tcp {
from {
protocol tcp;
}
then {
count accept-all-tcp;
log;
syslog;
accept;
}
}
term accept-all-udp {
from {
protocol udp;
}
then {
count accept-all-udp;
log;
syslog;
accept;
}
}
term accept-all-igmp {
from {
protocol igmp;
}
then {
count accept-all-igmp;
log;
syslog;
accept;
}
}
term accept-icmp {
from {
protocol icmp;
}
then {
count accept-all-icmp;
log;
syslog;
accept;
}
}
term accept-all-unknown {
then {
count accept-all-unknown;
log;
syslog;
accept;
}
}
}
filter accept-icmp {
apply-flags omit;
term no-icmp-fragments {
from {
is-fragment;
protocol icmp;
}
then {
count no-icmp-fragments;
log;
discard;
}
}
term accept-icmp {
from {
protocol icmp;
ttl-except 1;
icmp-type [ echo-reply echo-request time-exceeded unreachable
source-quench router-advertisement parameter-problem ];
}
then {
policer management-5m;
count accept-icmp;
accept;
}
}
}
filter discard-frags {
term 1 {
from {
first-fragment;
}
then {
count deny-first-frags;
discard;
}
}
term 2 {
from {
is-fragment;
}
then {
count deny-other-frags;
discard;
}
}
}
After all that work, don’t forget to actually apply all applicable filters as an input-list under family inet on the lo0 interface. Before making any changes, please carefully consider the following suggestions, however:
Before actually activating the lo0 application of the IPv4 protection filter, you should:
Confirm that all prefix lists are accurate for your networks and that they encompass the necessary address ranges.
Confirm that all valid services and remote access protocols are accepted in a filter, and that the filter is included in the input list; for example, in Day One: Securing the Routing Engine on M, MX, and T Series, the
accept-telnetfilter is not actually applied because Telnet is a nonsecure protocol, and frankly should never be used in a production network. While Telnet is used to access the testbed needed to develop this material, making the absence of theaccept-telnetfilter pretty obvious at time of commit . . . don’t ask me how I know this.Make sure the filter initially ends in a match-all term with accept and log actions to make sure no valid services are denied.
Consider using
commit confirmedfor this type of change. Again, don’t ask me how I know, but there is a hint in the preceding paragraphs.
The final RE protection filters used in this case study were modified from the example used in the Day One book in the following ways:
The
accept-telnetfilter is applied in the list; as a lab, Telnet is deemed acceptable. The OSPF and RIP filters are omitted as not in use or planned in the near future.The
accept-icmpfilter is modified to no longer match on fragments; this function is replaced with a global deny fragments filter that’s applied at the front of the filter list. See the related sidebar.
The list of filters applied to the lo0 interface of R1 for this example is shown; note that the list now begins with the discard-frags filter, the inclusion of the accept-telnet filter, and that the final discard-all filter is in effect. Again, for initial application in a production network, consider using a final match-all filter with accept and log actions to first confirm that no valid services are falling through to the final term before switching over to a final discard action.
The filter does not include the allow-ospf or allow-rip filters as the current test bed is using IS-IS, which cannot be affected by an inet family filter anyway. It’s worth noting that the accept-sh-bfd filter is so named as the port range specified allows single-hop BFD sessions only. According to draft-ietf-bfd-multihop-09.txt, “BFD for Multihop Paths” (now RFC 5883), multihop BFD sessions must use UDP destination port 4784:
{master}[edit]
user@R1-RE0# show interfaces lo0
unit 0 {
    family inet {
        filter {
            input-list [ discard-frags accept-sh-bfd accept-bgp
              accept-ldp accept-rsvp accept-telnet accept-common-services
              discard-all ];
        }
        address 10.3.255.1/32;
    }
    family iso {
        address 49.0001.0100.0325.5001.00;
    }
    family inet6 {
        address 2001:db8:1::ff:1/128;
    }
}
Warning
Pay attention to the filter order in the input-list to avoid any side effects. Actually, in the case above, if you place the accept-common-services before the filter accept-bgp your could rate-limit the eBGP session. Indeed in accept-common-services we rate-limit the TCP traceroute (TTL=1) and remember that eBGP (non-multihop) sessions use TCP packets with the TTL set to one.
A syslog is added to catch and consolidate any filter-related syslog actions for easy debug later. Remember, the log action writes to a kernel cache that is overwritten and lost in a reboot, while syslog can support file archiving and remote logging. Here, the local syslog is configured:
jnpr@R1-RE0# show system syslog
file re_filter {
    firewall any;
    archive size 10m;
}
After committing the filter, and breathing a sigh of relief as you confirm that remote access is still working (this time), let’s quickly look for any issues. To begin with, filter application is confirmed:
{master}[edit]
jnpr@R1-RE0# run show interfaces filters lo0
Interface       Admin Link Proto Input Filter         Output Filter
lo0             up    up
lo0.0           up    up   inet  lo0.0-i
                           iso
                           inet6
lo0.16384       up    up   inet
lo0.16385       up    up   inet
Next, examine the syslog to see what traffic is falling through unmatched to be discarded:
{master}[edit]
jnpr@R1-RE0# run show log re_filter
Dec 12 12:58:09  R1-RE0 fpc2 PFE_FW_SYSLOG_IP: FW: irb.200
                   D vrrp 192.0.2.67 224.0.0.18   0  0  (1 packets)
Dec 12 12:58:15  R1-RE0 last message repeated 7 times
Dec 12 12:58:16  R1-RE0 fpc2 PFE_FW_SYSLOG_IP: FW: irb.200
                   D vrrp 192.0.2.67 224.0.0.18   0  0  (2 packets)
Dec 12 12:58:17  R1-RE0 fpc2 PFE_FW_SYSLOG_IP: FW: irb.200
                   D vrrp 192.0.2.67 224.0.0.18   0  0  (1 packets)
Dec 12 12:58:21  R1-RE0 last message repeated 4 times
Dec 12 12:58:22  R1-RE0 fpc2 PFE_FW_SYSLOG_IP: FW: irb.200
                   D vrrp 192.0.2.67 224.0.0.18   0  0  (2 packets)
Dec 12 12:58:23  R1-RE0 fpc2 PFE_FW_SYSLOG_IP: FW: irb.200
                   D vrrp 192.0.2.67 224.0.0.18   0  0  (1 packets)
Dec 12 12:58:26  R1-RE0 last message repeated 3 times
Dec 12 12:58:27  R1-RE0 fpc2 PFE_FW_SYSLOG_IP: FW: irb.200
                   D vrrp 192.0.2.67 224.0.0.18   0  0  (2 packets)
Dec 12 12:58:28  R1-RE0 fpc2 PFE_FW_SYSLOG_IP: FW: irb.200
                   D vrrp 192.0.2.67 224.0.0.18   0  0  (1 packets)
Do’h! What was that warning about confirming the applied filter has support for all supported services, and about using an accept-all in the final term until proper operating is confirmed, again? The syslog action in the final discard-all filter has quickly shown that VRRP is being denied by the filter, which readily explains why VRRP is down, and the phones are starting to ring. The applied filter list is modified by adding the accept-vrrp filter; note the use of the insert function to ensure the correct ordering of filters by making sure that the discard-all filter remains at the end of the list:
{master}[edit interfaces lo0 unit 0 family inet]
jnpr@R1-RE0# set filter input-list accept-vrrp

{master}[edit interfaces lo0 unit 0 family inet]
jnpr@R1-RE0# show
filter {
    input-list [ discard-frags accept-sh-bfd accept-bgp
      accept-ldp accept-rsvp accept-telnet accept-common-services discard-all
      accept-vrrp ];
}
address 10.3.255.1/32;

{master}[edit interfaces lo0 unit 0 family inet]
jnpr@R1-RE0# insert filter input-list accept-vrrp before discard-all

{master}[edit interfaces lo0 unit 0 family inet]
jnpr@R1-RE0# show
filter {
    input-list [ discard-frags accept-ospf accept-rip
      accept-sh-bfd accept-bgp accept-ldp accept-rsvp accept-telnet accept-
      common-services accept-
        vrrp discard-all ];
}
address 10.3.255.1/32;
After the change the log file is cleared, and after a few moments redisplayed:
{master}[edit interfaces lo0 unit 0 family inet]
jnpr@R1-RE0# run clear log re_filter

. . .
{master}[edit interfaces lo0 unit 0 family inet]
jnpr@R1-RE0# run show log re_filter
Dec 12 13:09:59 R1-RE0 clear-log[21857]: logfile cleared

{master}[edit interfaces lo0 unit 0 family inet]
jnpr@R1-RE0#
Perfect—the lack of syslog entry and continued operation of existing services confirms proper operation of the IPv4 RE protection filter.
IPv6 RE Protection Filter
While we have IPv4 running, many networks are only now beginning to deploy IPv6. Given the lack of ubiquity, IPv6 control planes have not been the target of many attacks; many operators have not felt the need to deploy IPv6 RE protection, leading to a general lack of experience in IPv6 filtering best practices.
Next-header nesting, the bane of stateless filters
A significant issue with any IPv6 filtering scheme is IPv6’s use of next-header nesting, which makes some stateless filtering tasks tricky, if not downright impossible. IPv6, as defined in RFC 2460, states: “In IPv6, optional internet-layer information is encoded in separate headers that may be placed between the IPv6 header and the upper-layer header in a packet. . . . an IPv6 packet may carry zero, one, or more extension headers, each identified by the Next Header field of the preceding header.”
The net result is that there can be multiple extension headers placed between the IPv6 header and the upper layer protocol that you might want to match on (TCP, UDP, OSPF3, ICMP6, etc.). Stateless filters are designed to extract keys for matching packet fields using bit positions within a packet that are assumed to be found in the same location. Stateless IPv6 filters on Trio were historically only able to match on the first protocol (next header) identified in the IPv6 packet’s next-header field, and/or on bits within the actual payload, i.e., the transport protocol (TCP or UDP) ports. In the 14.2 release, Trio line cards are capable of matching on any extension header (regardless of whether it’s the first in the list), as well as a payload port. Note that the ability to match on any extension header is limited to non-fragmented/first fragment IPv6. The other packets which are not considered as a first fragment packet are still limited to matching only on the first extension header following the IPv6 header.
Note
Very long IPv6 headers (i.e., with a lot of next-headers) cannot be parsed by Junos. Remember that the lookup chip receives a chunk of the packet (the PARCEL) which includes the first 256 bytes. In others words, an IPv6 header larger than 256 bytes (which is a very rare case) will not be parsed entirely.
The ability to match both an extension header and a payload port is supported using the extension-header keyword. As of the Junos 14.2 release, the following extension header match types are supported:
jnpr@R1-RE0# ...t6 filter foo term 1 from extension-header ?
Possible completions:
  <range>              Range of values
  [                    Open a set of values
  ah                   Authentication header
  any                  Any extension header
  dstopts              Destination options
  esp                  Encapsulating security payload
  fragment             Fragment
  hop-by-hop           Hop by hop options
  mobility             Mobility
  routing              Routing
Note
Keep in mind that regardless of how many extension headers are present, Trio ASICs have the ability to extract the first 32 bits following the last extension header to facilitate Layer 4 (TCP or UDP) port-based matches, even when one or more extension headers are present. On a supported release, the ability to match on a payload protocol when extension headers are present is enabled by specifying the payload-protocol keyword in your match criteria.
First, note that the presence of extension headers can lead to unpredictable filter operation when the filter uses a next-header match condition because this option forces the match to occur immediately after the IPv6 header.
To show why such a match type can be problematic, consider a user who wants to filter out Multicast Listener Discovery messages (MLD), which does for IPv6 what IGMP does for IPv4: namely allowing multicast hosts to express interest in listening to a multicast group. In this case, the user knows that MLD is an extension of ICMP6, and happily proceeds to create (and commit) the filter shown, only to find MLD messages are not matched, and therefore still allowed to pass through the filter:
{master}[edit firewall family inet6]
jnpr@R1-RE0# show
filter count_mld {
    term 1 {
        from {
            next-header icmp;
            icmp-type [ membership-query membership-report membership
            -termination ];
        }
        then {
            count mld_traffic;
            discard;
        }
    }
    term 2 {
        then accept;
    }
}
In this case, a quick look at RFC for MLD (RFC 3810) and the previous restriction on being able to match on a single next-header makes the reason for the filter’s failure clear. MLD requires the inclusion of the hop-by-hop extension header (as shown above in the packet capture output), which must precede the ICMP6 header that the filter seeks to match:
Internet Protocol Version 6, Src: fe80::6687:88ff:fe63:47c1 (fe80::6687:88ff:
    fe63:47c1), Dst: ff02::1 (ff02::1)
    0110 .... = Version: 6
    .... 0000 0000 .... .... .... .... .... = Traffic class: 0x00000000
    .... .... .... 0000 0000 0000 0000 0000 = Flowlabel: 0x00000000
    Payload length: 32
    Next header: IPv6 hop-by-hop option (0)
    Hop limit: 1
    Source: fe80::6687:88ff:fe63:47c1 (fe80::6687:88ff:fe63:47c1)
    [Source SA MAC: JuniperN_63:47:c1 (64:87:88:63:47:c1)]
    Destination: ff02::1 (ff02::1)
    [Source GeoIP: Unknown]
    [Destination GeoIP: Unknown]
    Hop-by-Hop Option
        Next header: ICMPv6 (58)
        Length: 0 (8 bytes)
        IPv6 Option (Router Alert)
        IPv6 Option (PadN)
Internet Control Message Protocol v6
    Type: Multicast Listener Query (130)
    Code: 0
    Checksum: 0x236c [correct]
    Maximum Response Delay [ms]: 10000
    Reserved: 0000
    Multicast Address: :: (::)
This means if you want to filter MLD using a stateless filter you must, in fact, set the filter to match on the presence of the hop-by-hop header rather than the header you really wanted. The obvious issue here is that other protocols, like RSVP, can also make use of a hop-by-hop header (though Junos does not currently support IPv6-based MPLS signaling), so wholesale filtering based on hop-by-hop (or other extension) headers can lead to unexpected filtering actions.
In theory, this issue could be avoided by removing the next header match and replacing it with an extension header match; again, the latter would allow for a match of the specified header anywhere in the list rather than forcing it to be immediately behind the IPv6 header. The problem is that, as shown above, the 14.2 Junos release does not support ICMP as an argument to the extension header match.
Given that currently Trio firmware cannot match ICMP, the next best option here is to use a payload match type. Here, the payload is defined as the first portion of the packet that the firmware does not recognize, which in this case should equate to the ICMP header. A modified filter is shown:
{master}[edit firewall family inet6]
jnpr@R1-RE0# show
filter count_mld {
    term 1 {
        from {
            payload-protocol icmp6;
            icmp-type [ membership-query membership-report membership
            -termination ];
        }
        then {
            count mld_traffic;
            discard;
        }
    }
    term 2 {
        then accept;
    }
}
The sample IPv6 filter
As with the IPv4 filter example, it’s assumed that the reader is familiar with Junos firewall filter syntax and operation, as well as basic IPv6 protocol operation, header fields, and option extension headers. As always, when it comes to filters, no one size fits all, and the reader is encouraged to carefully consider the effects of the sample filter along with careful testing of its operation against the specific IPv6 protocols supported in their networks so that any necessary adjustments can be made before being placed into use on a production network.
Additional details on IPv6 protocol filtering specific to the broad range of possible ICMPv6 message types can be found in RFC 4890, “Recommendations for Filtering ICMPv6 Messages in Firewalls.”
To begin, the IPv6 prefix list definitions are displayed; the previous lists used for IPv4 remain in place, with the exception noted in the following:
jnpr@R1-RE0# show policy-options
prefix-list router-ipv4 {
. . .
prefix-list bgp-neighbors_v4 {
    apply-path "protocols bgp group <*_v4> neighbor <*>";
}
prefix-list router-ipv6 {
    apply-path "interfaces <*> unit <*> family inet6 address <*>";
}
prefix-list bgp-neighbors_v6 {
    apply-path "protocols bgp group <*_v6> neighbor <*>";
}
prefix-list link_local {
    fe80::/64;
}
prefix-list rfc3849 {
    2001:db8::/32;
}
The IPv6-based prefix list performs the same function as their V4 counterparts. IPv6’s use of Link Local addressing for many routing protocols means you need to include support for them, as well as your global IPv6 interface routes. Note that the previous bgp-neighbors prefix list, as originally used for IPv4, has been renamed and the apply-path regular expression modified, so as to not conflict with the same function in IPv6. This approach assumes that you place IPv4 and IPv6 peers in separate groups with a group name that ends in either _v4 or _v6. The IPv6 RE protection filters are displayed:
{master}[edit firewall family inet6]
jnpr@R1-RE0#
filter discard-extension-headers {
    apply-flags omit;
    term discard-extension-headers {
        from {
            # Beware - VRRPv3 with authentication or OSPFv3 with Authentication
                enabled may use AH/ESP!
            next-header [ ah dstopts egp esp fragment gre icmp igmp ipip ipv6
                no-next-header routing rsvp sctp ];
        }
        then {
            count discard-ipv6-extension-headers;
            log;
            syslog;
            discard;
        }
    }
}
filter deny-icmp6-undefined {
    apply-flags omit;
    term icmp6-unassigned-discard {
        from {
            next-header icmpv6;
            icmp-type [ 102-106 155-199 202-254 ];
        }
        then discard;
    }
    term rfc4443-discard {
        from {
            next-header icmpv6;
            icmp-type [ 100-101 200-201 ];
        }
        then discard;
    }
}
filter accept-icmp6-misc {
    apply-flags omit;
    term neigbor-discovery-accept {
        from {
            next-header icmpv6;
            icmp-type 133-136;
        }
        then accept;
    }
    term inverse-neigbor-discovery-accept {
        from {
            next-header icmpv6;
            icmp-type 141-142;
        }
        then accept;
    }
    term icmp6-echo-request {
        from {
            next-header icmpv6;
            icmp-type echo-request;
        }
        then accept;
    }
    term icmp6-echo-reply {
        from {
            next-header icmpv6;
            icmp-type echo-reply;
        }
        then accept;
    }
    term icmp6-dest-unreachable-accept {
        from {
            next-header icmpv6;
            icmp-type destination-unreachable;
        }
        then accept;
    }
    term icmp6-packet-too-big-accept {
        from {
            next-header icmpv6;
            icmp-type packet-too-big;
        }
        then accept;
    }
    term icmp6-time-exceeded-accept {
        from {
            next-header icmpv6;
            icmp-type time-exceeded;
            icmp-code 0;
        }
        then accept;
    }
    term icmp6-parameter-problem-accept {
        from {
            next-header icmpv6;
            icmp-type parameter-problem;
            icmp-code [ 1 2 ];
        }
        then accept;
    }
}
filter accept-shsh-bfd-v6 {
    apply-flags omit;
    term accept-sh-bfd-v6 {
        from {
            source-prefix-list {
                router-ipv6;
            }
            destination-prefix-list {
                router-ipv6;
            }
            source-port 49152-65535;
            destination-port 3784-3785;
        }
        then accept;
    }
}
filter accept-MLD-hop-by-hop_v6 {
    apply-flags omit;
    term bgp_v6 {
        from {
            next-header hop-by-hop;
        }
        then {
            count hop-by-hop-extension-packets;
            accept;
        }
    }
}
filter accept-bgp-v6 {
    apply-flags omit;
    term bgp_v6 {
        from {
            prefix-list {
                rfc3849;
                bgp-neighbors_v6;
            }
            next-header tcp;
            destination-port bgp;
        }
        then accept;
    }
}
filter accept-ospf3 {
    apply-flags omit;
    term ospfv3 {
        from {
            source-prefix-list {
                link_local;
            }
            next-header ospf;
        }
        then accept;
    }
}
filter accept-dns-v6 {
    apply-flags omit;
    term dnsv6 {
        from {
            source-prefix-list {
                rfc3849;
            }
            next-header [ udp tcp ];
            port domain;
        }
        then accept;
    }
}
filter accept-ntp-v6 {
    apply-flags omit;
    term ntpv6 {
        from {
            source-prefix-list {
                rfc3849;
            }
            next-header udp;
            destination-port ntp;
        }
        then accept;
    }
}
filter accept-ssh-v6 {
    apply-flags omit;
    term sshv6 {
        from {
            source-prefix-list {
                rfc3849;
            }
            next-header tcp;
            destination-port ssh;
        }
        then {
            policer management-5m;
            count accept-ssh;
            accept;
        }
    }
}
filter accept-snmp-v6 {
    apply-flags omit;
    term snmpv6 {
        from {
            source-prefix-list {
                rfc3849;
            }
            next-header udp;
            destination-port snmp;
        }
        then accept;
    }
}
filter accept-radius-v6 {
    apply-flags omit;
    term radiusv6 {
        from {
            source-prefix-list {
                rfc3849;
            }
            next-header udp;
            port [ 1812 1813 ];
        }
        then accept;
    }
}
filter accept-telnet-v6 {
    apply-flags omit;
    term telnetv6 {
        from {
            source-prefix-list {
                rfc3849;
            }
            next-header tcp;
            port telnet;
        }
        then {
            policer management-5m;
            count accept-ssh;
            accept;
        }
    }
}
filter accept-common-services-v6 {
    apply-flags omit;
    term accept-icmp6 {
        filter accept-icmp6-misc;
    }
    term accept-traceroute-v6 {
        filter accept-traceroute-v6;
    }
    term accept-ssh-v6 {
        filter accept-ssh-v6;
    }
    term accept-snmp-v6 {
        filter accept-snmp-v6;
    }
    term accept-ntp-v6 {
        filter accept-ntp-v6;
    }
    term accept-dns-v6 {
        filter accept-dns-v6;
    }
}
filter accept-traceroute-v6 {
    apply-flags omit;
    term accept-traceroute-udp {
        from {
            destination-prefix-list {
                router-ipv6;
            }
            next-header udp;
            destination-port 33435-33450;
            hop-limit 1;
        }
        then {
            policer management-1m;
            count accept-traceroute-udp-v6;
            accept;
        }
    }
    term accept-traceroute-icmp6 {
        from {
            destination-prefix-list {
                router-ipv6;
            }
            next-header icmp;
            icmp-type [ echo-request time-exceeded ];
            hop-limit 1;
        }
        then {
            policer management-1m;
            count accept-traceroute-icmp6;
            accept;
        }
    }
    term accept-traceroute-tcp-v6 {
        from {
            destination-prefix-list {
                router-ipv6;
            }
            next-header tcp;
            hop-limit 1;
        }
        then {
            policer management-1m;
            count accept-traceroute-tcp-v6;
            accept;
        }
    }
}
filter discard-all-v6 {
    apply-flags omit;
    term discard-HOPLIMIT_1-unknown {
        from {
            hop-limit 1;
        }
        then {
            count discard-all-HOPLIMIT_1-unknown;
            log;
            syslog;
            discard;
        }
    }
    term discard-tcp-v6 {
        from {
            next-header tcp;
        }
        then {
            count discard-tcp-v6;
            log;
            syslog;
            discard;
        }
    }
    term discard-netbios-v6 {
        from {
            next-header udp;
            destination-port 137;
        }
        then {
            count discard-netbios-v6;
            log;
            syslog;
            discard;
        }
    }
    term discard-udp {
        from {
            next-header udp;
        }
        then {
            count discard-udp-v6;
            log;
            syslog;
            discard;
        }
    }
    term discard-icmp6 {
        from {
            next-header icmp;
        }
        then {
            count discard-icmp;
            log;
            syslog;
            discard;
        }
    }
    term discard-unknown {
        then {
            count discard-unknown;
            log;
            syslog;
            discard;
        }
    }
}
Note
We used the next-header option in the preceding code to actually filter the payload. As discussed earlier, sometimes protocols include extension headers. In this case, you can use the payload match option. Remember that next-header is always the first header after the IPv6 header.
The IPv6 filters make use of the same policers defined previously for IPv4, and follow the same general modular approach, albeit with less counting actions in terms that accept traffic, their use already being demonstrated for IPv4. In this case, the discard-extension-headers filter discards all unused extension headers, including the fragmentation header, which ensures fragments are not subjected to any additional term processing where unpredictable results could occur given a fragment’s lack of a transport header. As per the filter’s comment, the discard action includes traffic with either the AH and/or EH authentication headers, which can be used for legitimate traffic like OSPF3. As always, you need to carefully gauge the needs of each network against any sample filter and make adjustments accordingly.
As before, the relevant list of IPv6 filters are again applied as an input list to the lo0 interface. Now under family inet6:
{master}[edit]
jnpr@R1-RE0# show interfaces lo0 unit 0
family inet {
    filter {
        input-list [ discard-frags accept-sh-bfd accept-bgp
          accept-ldp accept-rsvp accept-telnet accept-common-services
          accept-vrrp discard-all ];
    }
    address 10.3.255.1/32;
}
family iso {
    address 49.0001.0100.0325.5001.00;
}
family inet6 {
    filter {
        input-list [ discard-extension-headers accept-MLD-hop-by-hop_v6
          deny-icmp6-undefined accept-sh-bfd-v6 accept-bgp-v6
          accept-telnet-v6 accept-ospf3 accept-radius-v6 accept-common-services-
          v6 discard-all-v6 ];
    }
    address 2001:db8:1::ff:1/128;
}
After applying the IPv6 filter, the syslog is cleared; after a few moments, it’s possible to display any new matches. Recall that at this stage only unauthorized traffic should be reaching the final discard-all action for both the IPv4 and IPv6 filter lists:
{master}[edit]
jnpr@R1-RE0# run show log re_filter
Dec 13 10:26:51 R1-RE0 clear-log[27090]: logfile cleared
Dec 13 10:26:52  R1-RE0 /kernel: FW: fxp0.0  D  tcp 172.17.13.146 172.19.90.172
  34788  21
Dec 13 10:26:55  R1-RE0 /kernel: FW: fxp0.0  D  tcp 172.17.13.146 172.19.90.172
  34788  21
Dec 13 10:26:55  R1-RE0 /kernel: FW: fxp0.0  D igmp 172.19.91.95 224.0.0.1  0  0
Dec 13 10:27:01  R1-RE0 /kernel: FW: fxp0.0  D  tcp 172.17.13.146 172.19.90.172
  34788  21
Dec 13 10:27:55  R1-RE0 /kernel: FW: fxp0.0  D igmp 172.19.91.95 224.0.0.1  0  0
. . .
Dec 13 10:34:41  R1-RE0 /kernel: FW: fxp0.0  D  udp 172.19.91.43 172.19.91.255
  138  138
Dec 13 10:34:55  R1-RE0 /kernel: FW: fxp0.0  D igmp 172.19.91.95 224.0.0.1  0  0
Dec 13 10:35:55  R1-RE0 /kernel: FW: fxp0.0  D igmp 172.19.91.95 224.0.0.1  0  0
Dec 13 10:36:55  R1-RE0 /kernel: FW: fxp0.0  D igmp 172.19.91.95 224.0.0.1  0  0
The result shown here is good. The only traffic not being accepted by other terms is coming from unauthorized hosts at 172.17.13.0/24, an address not included in the official lab topology, which shows the filter is having the desired effect. All the discarded traffic arrives on the shared OoB management network via fxp0, and appears to be a mix of IGMP, FTP, and NetBIOS. As a final confirmation, you confirm BGP and BFD session status at R1:
{master}[edit]
jnpr@R1-RE0# run show bgp summary
Groups: 3 Peers: 3 Down peers: 1
Table          Tot Paths  Act Paths Suppressed    History Damp State    Pending
inet.0                 0          0          0          0          0          0
inet6.0                0          0          0          0          0          0
Peer                AS     InPkt  OutPkt  OutQ  Flaps Last Up/Dwn State|
  #Active/Received/Accepted/Damped...
10.3.255.2          65000  2010   2009    0     0    15:09:23 0/0/0/0
2001:db8:1::ff:2    65000   298    296    0     2     2:13:16 Establ
  inet6.0: 0/0/0/0
fd1e:63ba:e9dc:1::1 65010     0      0    0     0    17:52:23 Active
At this point, the EBGP session to the external BGP P1 device is expected to be down, but both the IPv6 and IPv4 IBGP sessions are established, as is the BFD session between R1 and R2. This BFD session is IPv4-based and runs over the ae0.1 interface to provide the IS-IS protocol with rapid fault detection capabilities:
{master}[edit]
jnpr@R1-RE0# show protocols isis
reference-bandwidth 100g;
level 1 disable;
interface ae0.1 {
    point-to-point;
    bfd-liveness-detection {
        minimum-interval 1000;
        multiplier 3;
    }
}
interface lo0.0 {
    passive;
}

{master}[edit]
jnpr@R1-RE0# run show bfd session
                                                  Detect   Transmit
Address                  State     Interface      Time     Interval  Multiplier
10.8.0.1                 Up        ae0.1          3.000     1.000        3

1 sessions, 1 clients
Cumulative transmit rate 1.0 pps, cumulative receive rate 1.0 pps
The continued operation of permitted services coupled with the lack of unexpected log entries from the discard-all action of both RE protection filters confirms they are working as designed and concludes the RE protection case study.
DDoS Protection Case Study
The MX Trio platforms began offering built-in DDoS protection starting with release v11.2. This feature makes use of the extensive host-bound traffic classification capabilities of the Trio chipset along with corresponding policers, implemented at various hierarchies within the system, to ensure the RE remains responsive in the event of excessive control plane exception traffic, such as can occur as the result of misconfigurations, excess scaling, or intentional DDoS types of attacks targeting a router’s control plane.
The new low-level DDoS protection provides great benefits right out of the box, so to speak, but does not in itself mitigate the need for a RE protection filter to deny traffic that is not allowed or needed. When the new DDoS protection is combined with a strong RE filter, you can eliminate the need for policing functions in the filter, or for added protection you can continue to use RE filter-based policing as an added measure of safeguard, but in these cases you should ensure the RE filter-based policers have higher bandwidth values then the corresponding PFE and RE DDoS policers, or the policers in the RE will never have a chance to activate as the DDoS policers will see all the discard action. This is because a policer called from an input filter on the loopback interface is downloaded to the Trio PFE where it is executed before any DDoS policer functionality.
The Issue of Control Plane Depletion
As routers scale to provide service to more and more users with ever increasing numbers of services, it’s not uncommon to find them operating near their capacity, especially in periods of heavy load such as route flap caused by network failures. With each new service comes additional load, but also the potential for unexpected resource usage either due to intent or in many cases because of buggy software or configuration errors that lead to unexpected operation.
Resource exhaustion can occur in a number of different places, each having their own set of operational issues. Run short on RIB/FIB and you may blackhole destinations or start using default routes with possibly undesirable paths. Low memory can lead to crashes, or slow reconvergence, as processes start swapping to disk. Run low on CPU, or on the internal communications paths needed to send and receive sessions to keep alive messages, and here comes even more trouble as BFD, BGP, and OSPF sessions begin flapping, which in turn only add more churn to an already too busy system.
In this section, the focus is on protecting the processing path, and therefore the control plane resources. Those control plane resources are needed to process remote access, routing protocols, and network management traffic as they make their way from a network interface through the PFE and onto the RE during periods of unexpected control plane traffic. The goal is to allow supported services, at reasonable levels, without allowing any one service or protocol to overrun all resources, a condition that can easily lead to denial of service for other protocols and users. Such a service outage can easily extend into the remote access needed to access a router in order to troubleshoot and correct the issue. There is little else in life as frustrating as knowing how to fix a problem, only to realize that because of the problem, you’re unable to access the device to take corrective actions.
DDoS Operational Overview
The Juniper DDoS protection feature is based on two main components: the classification of host-bound control plane traffic and a hierarchical set of individual- and aggregate-level policers that cap the volume of control plane traffic that each protocol type is able to send to the RE for processing.
These policers are organized to match the hierarchical flow of protocol control traffic. Control traffic arriving from all ports of a line card converges at the card’s Packet Forwarding Engine. Traffic from all PFEs converges into the line card/FPC. And lastly, control traffic from all line cards on the router converges on the Routing Engine. Similarly, the DDoS policers are placed hierarchically along the control paths so that excess packets are dropped as early as possible on the path. This design preserves system resources by removing excess malicious traffic so that the Routing Engine receives only the amount of traffic that it can actually process. In total, there can be as many as five levels of policing between ingress at the Trio PFE and processing at RE, and that’s not counting any additional lo0-based filtering (with related policing) that can also be in effect.
In operation, control traffic is dropped when it violates a policer’s rate limit. Each violation generates a notification in the syslog to alert the operator about a possible attack. Each violation is counted and its start time is noted, and the system also maintains a pointer to the last observed violation start and end times. When the traffic rate drops below the bandwidth violation threshold, a recovery timer determines when the traffic flow is considered to have returned to normal. If no further violation occurs before the timer expires, the violation state is cleared and a notification is again generated to report clearing of the DDoS event.
Once notified, it’s the operator’s responsibility to analyze the nature of the event to make a determination if the traffic type and volume that triggered the DDoS event was expected or abnormal. There is no easy answer here, as each network is scaled to different values with a differing mix of protocols and rate of churn. If the analysis concludes the volume of traffic was normal, then the related policers should be increased to avoid false alarms and potential service disruptions in the future. In contrast, protocols that are not used, or which are known to generate low message volume, can have their policers decreased.
Note
The default policer settings are intentionally set high to ensure there are no unwanted side effects to preexisting installations as they are upgraded to newer code with DDoS protection support, which is enabled by default. In most cases, operators will want to characterize their network’s expected control plane load and then decrease the default policer values to ensure they gain robust DDoS protection from the feature.
Policer states and statistics from each line card are relayed to the Routing Engine and aggregated. The policer states are maintained during a switchover. Note that during a GRES/NSR event, line card statistics and violation counts are preserved but RE policer statistics are not.
Warning
At this time, DDoS protection is a Trio-only feature. You can configure and commit it on a system that has older, DPC-style line cards but there will be no DDoS protection on those line cards. A chain is only as strong as the worst link; a system with a single line card that does not support DDoS is still vulnerable to an attack.
Collect some figures
As mentioned, the default policers are intentionally set high to avoid any side effects in any configuration from the smallest to the largest with intensive protocol notifications. The DDoS protection feature provides real-time statistics at each level (PFE, line card, and RE) and for each protocol. Let’s take the example of the ICMP protocol:
jnpr@R1-RE0> show ddos-protection protocols icmp statistics
Packet types: 1, Received traffic: 1, Currently violated: 0

Protocol Group: ICMP

  Packet type: aggregate
    System-wide information:
      Aggregate bandwidth is never violated
      Received:  285                 Arrival rate:     0 pps
      Dropped:   0                   Max arrival rate: 1 pps
    Routing Engine information:
      Aggregate policer is never violated
      Received:  285                 Arrival rate:     0 pps
      Dropped:   0                   Max arrival rate: 1 pps
        Dropped by individual policers: 0
    FPC slot 0 information:
      Aggregate policer is never violated
      Received:  185                 Arrival rate:     0 pps
      Dropped:   0                   Max arrival rate: 1 pps
        Dropped by individual policers: 0
        Dropped by flow suppression:    0
    FPC slot 1 information:
      Aggregate policer is never violated
      Received:  100                 Arrival rate:     0 pps
      Dropped:   0                   Max arrival rate: 0 pps
        Dropped by individual policers: 0
        Dropped by flow suppression:    0
FPC statistics provide information for the entire line card, meaning that you don’t have per-PFE statistics but only aggregated information regarding passed or dropped traffic from an MPC point of view. Actually, the per-PFE statistics are only displayed by a PFE command, presented in a few more pages. The Routing-Engine information and the system-wide information shown in the device output should be the same in a single chassis configuration. And as observed in this sample output, all ICMP traffic has been allowed without any policing: the RE received 285 ICMP packets, the sum of the 185 packets received on FPC 0 plus the 100 packets received on FPC 1.
These statistics can be cleared, per-protocol, with the following operational command:
jnpr@R1-RE0> clear ddos-protection protocols <protocol> statistics
When attempting to tune the DDoS policers a logical first step is to collect up-to-date data corresponding to your current network’s baseline for all supported protocols. This data should reflect PFE, MPC, and RE aggregate statistics, as optimal tuning may involve altering policers at all these hierarchies. Once obtained, you can define a reasonable starting value for each policer by adding a small margin of safety to the observed baseline; a sample of this method is provided below.
Because DDoS is enabled by default for all supported protocols, it’s a trivial matter of simply looking at the resulting DDoS statistics to begin baseline analysis. Key among these statistics is the “Max arrival rate” information. By analyzing the peak rate of each protocol (which should be done at several points of your network and over a reasonably sized monitoring window that, of course, includes periods of peak activity), you will have an accurate (and current) view of the maximum per protocol rate for your network in normal operating state. Given that few networks remain the same over time, you should periodically revisit DDoS tuning to make sure your policers always reflect a reasonably current snapshot of expected protocol loads. If not obvious, you should retune DDoS policers whenever a new protocol or service is added to your network.
You can easily use the power of Junos scripting to simplify the monitoring of a particular DDoS counter at a given hierarchy—for example, at the Routing Engine or versus the MPC level. The sample operational mode script (op script) shown here is used to display the current and maximum observed rates at the Routing Engine on a per protocol/packet type basis:
version 1.0;
ns junos = "http://xml.juniper.net/junos/*/junos";
ns xnm = "http://xml.juniper.net/xnm/1.1/xnm";
ns jcs = "http://xml.juniper.net/junos/commit-scripts/1.0";
import "../import/junos.xsl";

match / {
<op-script-results> {
/* Take traces */
var $myrpc = <get-ddos-protocols-statistics> {};
var $myddos = jcs:invoke ($myrpc);
/* Now Display */
 <output> "";
 <output> "";
 <output> "+----------------------------------------------------------------+";
 <output> jcs:printf('|%-20s |%-20s |%-11s |%-10s\n',"Protocol","Packet Type",
 "Current pps","Max pps Observed");
 <output> "+----------------------------------------------------------------+";
 for-each( $myddos/ddos-protocol-group/ddos-protocol/packet-type ) {
    var $name = .;
    if (../ddos-system-statistics/packet-arrival-rate-max != "0"){
      <output> jcs:printf('|%-20s |%-20s |%-11s |%-10s\n',../../group-name,
      $name,../ddos-system-statistics/packet-arrival-rate,../ddos-system-
      statistics/packet-arrival-rate-max);
     }
  }
<output> "+----------------------------------------------------------------+";
}
}
Note
Only packet-types with a “max arrival rate” greater than 0 are displayed.
This code must be copied onto the router under some filename—here, the file is called checkddos.slax, which is in turn stored in the /var/db/scripts/op folder. Next, the op script must be declared and activated in the configuration:
jnpr@R1-RE0# set system scripts op file checkddos.slax
Next, all DDOS statistics are cleared on the various routers that are used to form your baseline; for example, choose at least your largest node in addition to at least 1 P router, 1 PE router, 1 access node, etc. To make things simple, this example focuses on statistics from just one node. In a real network, for optimal protection you must dimension and tune based on each node’s role and the resulting traffic load it experiences:
jnpr@R1-RE0> clear ddos-protection protocols statistics
Determine your baseline
Control plane traffic can vary dramatically based on time of day usage patterns. In addition, you should consider the effects of a network outage as the period of reconvergence that follows is likely to represent a peak for some types of control plane traffic. As a result, you must allow the statistics to build up over a significant period of time, such as 24 hours or perhaps even for an entire week. In effect, your goal should be to “Let the network live its life,” after which you collect the data via the op script on the routers being sampled in your baseline. As noted above, it’s a good idea to plan for some type of stress testing (during a maintenance window, of course) such as performing link flaps, restarting routing, or even a router reboot. It’s likely that during recovery protocols like BGP you will find far higher pps rates, and corresponding RE load, than would be seen in steady state converged operation.
Note
In any tuning operation, there is no one-size-fits-all rule. You are always trading one thing for another. For example, if your goal is speed of reconvergence after a major outage, you will likely want to set a relatively high DDoS policer value to ensure that legitimate protocol traffic is not dropped, as that would prolong convergence. Then again, setting the policer to reflect an absolute worst-case load for all protocols tends to lessen the overall level of RE protection in the event of a real DDoS attack. Many will opt to take the difference between converged (normal) load and re-converging load (abnormal but legitimate), and use that as a compromise.
Sample output of the op script is provided:
jnpr@R1-RE0> op checkddos
+-------------------------------------------------------------------------+
|Protocol             |Packet Type          |Current pps |Max pps Observed
+-------------------------------------------------------------------------+
|resolve              |aggregate            |0           |67081
|resolve              |mcast-v4             |0           |67081
|ICMP                 |aggregate            |0           |1
|IGMP                 |aggregate            |0           |30
|PIM                  |aggregate            |1           |63
|RIP                  |aggregate            |15          |116
|LDP                  |aggregate            |10          |71
|BGP                  |aggregate            |43          |7834
|VRRP                 |aggregate            |7           |15
|SSH                  |aggregate            |3           |564
|SNMP                 |aggregate            |0           |145
|BGPv6                |aggregate            |0           |22
|LACP                 |aggregate            |21          |24
|ARP                  |aggregate            |0           |10
|ISIS                 |aggregate            |12          |643
|TCP-Flags            |aggregate            |2           |2
|TCP-Flags            |established          |2           |2
|TACACS               |aggregate            |0           |19
|Sample               |aggregate            |0           |3
|Sample               |syslog               |0           |1
|Sample               |pfe                  |0           |1
+-------------------------------------------------------------------------+
Host-bound traffic classification
A modern multiservice router has to support a myriad of protocols, and multiprotocol support inherently assumes a method of recognizing each protocol so it can be directed to the correct processing daemon. The DDoS protection feature latches on to the Trio chipset’s rich protocol classification capability to correctly recognize and bin a large number of subscriber access, routing, network management, and remote access protocols. The current list is already large and expected to grow:
{master}[edit system ddos-protection global]
jnpr@R1-RE0# run show ddos-protection version
DDOS protection, Version 1.0
  Total protocol groups       = 98
  Total tracked packet types  = 220
The display shows that in v1.0, there are 98 protocol groups with a total of 220 unique packets types that can be individually policed. The Junos CLI’s ? feature is used here to display the current list:
{master}[edit system ddos-protection]
jnpr@R1-RE0# set protocols ?
Possible completions:
> amtv4                Configure AMT v4 control packets
> amtv6                Configure AMT v6 control packets
> ancp                 Configure ANCP traffic
> ancpv6               Configure ANCPv6 traffic
+ apply-groups         Groups from which to inherit configuration data
+ apply-groups-except  Don't inherit configuration data from these groups
> arp                  Configure ARP traffic
> atm                  Configure ATM traffic
> bfd                  Configure BFD traffic
> bfdv6                Configure BFDv6 traffic
> bgp                  Configure BGP traffic
> bgpv6                Configure BGPv6 traffic
> demux-autosense      Configure demux autosense traffic
> dhcpv4               Configure DHCPv4 traffic
> dhcpv6               Configure DHCPv6 traffic
> diameter             Configure Diameter/Gx+ traffic
> dns                  Configure DNS traffic
> dtcp                 Configure dtcp traffic
> dynamic-vlan         Configure dynamic vlan exceptions
> egpv6                Configure EGPv6 traffic
> eoam                 Configure EOAM traffic
> esmc                 Configure ESMC traffic
> fab-probe            Configure fab out probe packets
> filter-action        Configure filter action traffic
> frame-relay          Configure frame relay control packets
> ftp                  Configure FTP traffic
> ftpv6                Configure FTPv6 traffic
> gre                  Configure GRE traffic
> icmp                 Configure ICMP traffic
> icmpv6               Configure ICMPv6 traffic
> igmp                 Configure IGMP traffic
> igmpv4v6             Configure IGMPv4-v6 traffic
> igmpv6               Configure IGMPv6 traffic
> inline-ka            Configure inline keepalive packets
> inline-svcs          Configure inline services
> ip-fragments         Configure IP-Fragments
> ip-options           Configure ip options traffic
> isis                 Configure ISIS traffic
> jfm                  Configure JFM traffic
> l2pt                 Configure Layer 2 protocol tunneling
> l2tp                 Configure l2tp traffic
> lacp                 Configure LACP traffic
> ldp                  Configure LDP traffic
> ldpv6                Configure LDPv6 traffic
> lldp                 Configure LLDP traffic
> lmp                  Configure LMP traffic
> lmpv6                Configure LMPv6 traffic
> mac-host             Configure L2-MAC configured 'send-to-host'
> mcast-snoop          Configure snooped multicast control traffic
> mlp                  Configure MLP traffic
> msdp                 Configure MSDP traffic
> msdpv6               Configure MSDPv6 traffic
> mvrp                 Configure MVRP traffic
> ndpv6                Configure NDPv6 traffic
> ntp                  Configure NTP traffic
> oam-lfm              Configure OAM-LFM traffic
> ospf                 Configure OSPF traffic
> ospfv3v6             Configure OSPFv3v6 traffic
> pfe-alive            Configure pfe alive traffic
> pim                  Configure PIM traffic
> pimv6                Configure PIMv6 traffic
> pmvrp                Configure PMVRP traffic
> pos                  Configure POS traffic
> ppp                  Configure PPP control traffic
> pppoe                Configure PPPoE control traffic
> ptp                  Configure PTP traffic
> pvstp                Configure PVSTP traffic
> radius               Configure Radius traffic
> redirect             Configure packets to trigger ICMP redirect
> reject               Configure packets via 'reject' action
> rejectv6             Configure packets via 'rejectv6' action
> resolve              Configure resolve traffic
> rip                  Configure RIP traffic
> ripv6                Configure RIPv6 traffic
> rsvp                 Configure RSVP traffic
> rsvpv6               Configure RSVPv6 traffic
> sample               Configure sampled traffic
> services             Configure services
> snmp                 Configure SNMP traffic
> snmpv6               Configure SNMPv6 traffic
> ssh                  Configure SSH traffic
> sshv6                Configure SSHv6 traffic
> stp                  Configure STP traffic
> syslog               Configure syslog traffic
> tacacs               Configure TACACS traffic
> tcp-flags            Configure packets with tcp flags
> telnet               Configure telnet traffic
> telnetv6             Configure telnet-v6 traffic
> ttl                  Configure ttl traffic
> tunnel-fragment      Configure tunnel fragment
> tunnel-ka            Configure tunnel keepalive packets
> unclassified         Configure unclassified host-bound traffic
> virtual-chassis      Configure virtual chassis traffic
> vrrp                 Configure VRRP traffic
> vrrpv6               Configure VRRPv6 traffic
As extensive as the current protocol list is, it’s just the outer surface of the MX router’s protocol recognition capabilities; all of the protocol groups listed support aggregate-level policing and many also offer per-packet type policers that are based on the individual message types within that protocol. For example, the PPP over Ethernet (PPPoE) protocol group contains an aggregate policer in addition to numerous individual packet type policers:
{master}[edit system ddos-protection]
jnpr@R1-RE0# set protocols pppoe ?

Possible completions:
> aggregate            Configure aggregate for all PPPoE control traffic
+ apply-groups         Groups from which to inherit configuration data
+ apply-groups-except  Don't inherit configuration data from these groups
> padi                 Configure PPPoE PADI
> padm                 Configure PPPoE PADM
> padn                 Configure PPPoE PADN
> pado                 Configure PPPoE PADO
> padr                 Configure PPPoE PADR
> pads                 Configure PPPoE PADS
> padt                 Configure PPPoE PADT
{master}[edit system ddos-protection]
In contrast, ICMP is currently supported at the aggregate level only:
{master}[edit system ddos-protection protocols]
jnpr@R1-RE0# set icmp ?
Possible completions:
> aggregate            Configure aggregate for all ICMP traffic
+ apply-groups         Groups from which to inherit configuration data
+ apply-groups-except  Don't inherit configuration data from these groups
{master}[edit system ddos-protection protocols]
jnpr@R1-RE0# set icmp
Being able to recognize this rich variety of traffic at ingress means it can be directed to an equally rich set of policing functions to ensure the control plane load remains within acceptable limits. Given that many protocol groups support both individual packet type policers as well as aggregate-level policing at multiple locations in the host-bound processing path, the DDoS protection feature provides both effective and fine-grained control over host processing path resource protection.
A gauntlet of policers
Hierarchical policing is the DDoS prevention muscle behind the host-bound classification brains. This style of hierarchical policing is more akin to cascaded policers and should not be confused with the hierarchical policer discussed previously. The goal is to take action to limit excessive traffic as close to the source as possible, with each lower policer component feeding into a higher level policer, until a final policed aggregate for that protocol type is delivered to the RE for processing.
Figure 4-2 details the various DDoS policing hierarchies in the context of the PPPoE protocol group.
Figure 4-2. DDoS policing points for the PPPoE family
The first level of policing is performed at ingress to the Trio chipset (either the LU or XL chip), shown in step 1, where each protocol group is subjected to a single policing stage that is either aggregate or individual packet type based.
Note
Currently, DHCP uses only an aggregate-level policer at the PFE stage, as is also the case at all stages for protocols that don’t support individual packet type policing. At the PFE and RE hierarchies, DHCP for IPv4 and IPv6 is handled by two-stage policing based on individual message types, in addition to an aggregate rate for the group.
The next level of policing occurs in the line card (FPC) level, as the aggregate stream from all PFEs housed on the FPC contend for their place in the host processing queue. In most cases, including DHCP, the second line of policing consists of two stages: the first for individual message types and the second for the protocols group aggregate, which is shown at steps 2 and 3. Only those messages accepted at the first step are seen at stage 2, and any packet accepted at steps 1 and 2 is still very much subject to discard by the aggregate-level policer at step 3 when there’s too much activity in its group.
Strict queuing is performed within individual message policers for a given protocol group to manage contention for the group’s aggregate policer, based on a configured priority of high, medium, or low. The strict priority handling is shown at the top of the figure, where PADT traffic consumes all 1,000 pps of the group’s aggregate allowance even though other PPPoE message types are waiting. Here, PPPoE Active Discovery Termination (PADT) is considered more important than PPPoE Active Discovery Initiation (PADI), as it allows the release of PPPoE resources, which in turn facilitates the acceptance of new connections. Given the strict priority, all PADI will be dropped if PADT packets use up all the tokens of the PPPoE aggregate policer.
Note
Because high-priority traffic can starve lower priority traffic within its group, you should thoroughly consider modifying the priority for a given message type as the defaults have been carefully designed for optimal performance in the widest range of use cases.
The final level of policing hierarchy occurs within the RE itself, with another round of protocol group-based two-stage policing, shown in steps 4 and 5 within Figure 4-2. The output of this final stage consists of all the packet types for that group that were accepted by all policing stages in the path, which is then handed off to the associated daemon for message processing, assuming there are no lo0 filters or policers also in the host processing path.
The net result is a minimum of three policing stages for protocols that don’t have individual packet type policers and five for those that do. Aggregate-only groups currently include ANCP, dynamic VLAN, FTP, and IGMP traffic. Groups that support both stages of policing currently include DHCPv4, MLP, PPP, PPPoE, and virtual chassis traffic. As the feature matures, groups that are currently aggregate level only can be enhanced to support individual message type policing as the need arises.
By default, all three stages of policing (Trio chipset, line card, and Routing Engine) have the same bandwidth and burst limits for a given packet type. This design enables all the control traffic from a chipset and line card to reach the RE, as long as there is no competing traffic of the same type from other chipsets or line cards. When competing traffic is present, excess packets are dropped at the convergence points, which are the line card for all competing chipsets and the RE for all competing line cards. You can use a scaling factor to reduce the first two stages below the default values (100% of that used in the RE) to fine-tune performance.
Note that there is no priority mechanism at the aggregate policer merge points, as shown in Figure 4-2. While there is no explicit prioritization, the bandwidth is allocated in a statistically fair manner, which is to say, higher rate traffic streams get proportionally more bandwidth than lower rate streams, and by the same token, during congestion higher rate streams will also see more discards.
The default policer values are intentionally set high to ensure valid services are not disrupted, given the DDoS feature is enabled by default, and each network varies with regard to what is considered a normal control plane load. Also, there is no one default size for all protocol groups because some message types are processed locally in the line card, and so can have a higher value, and the processing load can vary significantly for those that are sent to the RE. To gain maximum DDoS prevention, rather than after-the-fact notification, it’s expected that each network operator will reduce policer values from their generous defaults after analyzing actual load in their network. A specific method for tuning DDOS based on your network’s particulars was detailed in a previous section.
DDoS Configuration and Operational Verification
The DDoS prevention feature is configured at the [edit system ddos-protection] hierarchy. While there, you can alter the default policer and priority values for a long list of protocols, configure tracing, or modify global operating characteristics such as disabling RE or FPC level DDOS policers and event logging.
{master}[edit system ddos-protection]
jnpr@R1-RE0# set ?
Possible completions:
+ apply-groups         Groups from which to inherit configuration data
+ apply-groups-except  Don't inherit configuration data from these groups
> global               DDOS global configurations
> protocols            DDOS protocol parameters
> traceoptions         DDOS trace options
{master}[edit system ddos-protection]
Disabling and tracing
You can disable policing at the FPC level (CPU of the line card + PFE) by including the disable-fpc statement. Likewise, you can use the disable-routing-engine statement to do the same for the RE’s policers. Moreover, you can disable policing for a specific protocol:
{master}[edit system ddos-protection protocol icmp aggregate]
jnpr@R1-RE0# show
disable-routing-engine;
disable-fpc;
The two options combine to disable aggregate policing at all three levels of the hierarchy, specifically, at the PFE, FPC, and RE levels. Note that currently you cannot disable policing for individual packet types at the ingress Trio PFE level, and that even when aggregate policing is disabled, the related daemon continues to run and statistics are still available: only the policing function is shut off.
If desired, you can completely disable the DDoS daemon, which is called jddosd, with a set system processes ddos-protection disable configuration statement.
If you encounter unexpected DDoS behavior, and nothing else seems to help, consider restarting the jddosd process with a restart ddos-protection operational mode command.
Note
In the initial release, the default DDoS policer values are equal to the same “higher than host path can support” rates as are used when the feature is disabled. This means the only real effect to disabling the feature when defaults are in place is whether or not you receive alerts when a policer is violated. This also means that if you do not model your network’s control plane loads and reduce the default policer values accordingly, you are not gaining nearly as much protection from the DDoS feature as you could.
The decision to use default values that are higher than the host-bound path can actually support is based on the feature being enabled by default and the desire to be extra cautious about changing behavior when a customer upgrades to a newer version with DDoS support.
You can enable tracing to get additional information about DDoS operation and events by including trace flags—tracing is disabled by default. If desired, you can specify a log name and archive settings, rather than settle for the default /var/log/ddosd syslog, which by default is allowed to be 128 Kbytes before it’s saved as one of three rolling archive files named ddosd.0 through ddosd.2. The currently supported trace flags are displayed:
{master}[edit system ddos-protection]
jnpr@R1-RE0# set traceoptions flag ?
Possible completions:
  all                  Trace all areas of code
  config               Trace configuration code
  events               Trace event code
  gres                 Trace GRES code
  init                 Trace initialization code
  memory               Trace memory management code
  protocol             Trace DDOS protocol processing code
  rtsock               Trace routing socket code
  signal               Trace signal handling code
  state                Trace state handling code
  timer                Trace timer code
  ui                   Trace user interface code
{master}[edit system ddos-protection]
jnpr@R1-RE0# set traceoptions flag
A typical trace configuration is shown, in this case creating a syslog called ddos_trace with a file size of 10 Mbytes, tracking events and protocol-level operations. DDoS logging occurs at the notice severity level, so if you specify something less severe (like info) you will not see any trace logs:
{master}[edit system ddos-protection]
jnpr@R1-RE0# show traceoptions
file ddos_trace size 10m;
level notice;
flag protocol;
flag events;
Granted, there is not much to see on a system that’s not currently under some type of attack:
{master}[edit system ddos-protection]
jnpr@R1-RE0# run show log ddos_trace

{master}[edit system ddos-protection]
jnpr@R1-RE0#
Configure protocol group properties
You can configure aggregate (and individual packet type) policing parameters when supported by the protocol group at the [edit system ddos-protection protocols] hierarchy. In most cases, a given group’s aggregate policer has a larger bandwidth and burst setting, which is calculated on a per packet basis, than any individual packet type policer in the group; however, the sum of individual policers can exceed the group’s aggregate rate. By default, the FPC and Trio PFE-level policers inherit bandwidth and burst size percentages values that are based on 100% of the aggregate or individual packet policer rate used at the RE level. From here, you can reduce or scale down the FPC percentages to limit them to a value below the RE policer rates, when desired. Again, the default setting of matching the FPC to the RE rate ensures that when no excess traffic is present, all messages accepted by the Trio policers are also accepted by the FPC-level policers, which in turn are also accepted by the RE-level policers.
In addition to policer parameters, you can also configure whether an individual policer type should bypass that group’s aggregate policer (while still having its individual packet type statistics tracked), whether exceptions should be logged, the scheduling priority for individual packet type policers, and the recovery time. You can also disable RE- or FPC-level policing on a per protocol group/message type basis.
This example shows aggregate and individual packet type policer settings for the ip-options group:
protocols {
    ip-options {
        aggregate {
            bandwidth 10000;
            burst 500;
        }

        unclassified {
            priority medium;
        }

        router-alert {
            bandwidth 5000;
            recover-time 150;
            priority high;
        }
    }
}
The bandwidth and burst settings are measured in units of packets per second. The example shown explicitly sets the bandwidth and burst values for the ICMP aggregate policer and router alert individual message policers, and modifies the unclassified ICMP packet type to medium priority from its default of low. The router alert packet type has high priority by default; this example explicitly sets the default value. When burst size is not explicitly configured for an individual packet type, it inherits a value based on the aggregate’s default using a proprietary mechanism that varies the burst size according to the assigned priority, where high priority gets a higher burst size.
In this case, the aggregate rate has been reduced from 20 kpps to 10 kpps with a 500 packet burst size. The router alert individual message type has its bandwidth set to one-half that of the aggregate at 5 kpps; has been assigned a 150-second recovery time, which determines how long the traffic has to be below the threshold before the DDoS event is cleared; and has been assigned a high priority (which was the default for this message type). The only change made to the unclassified packet type is to assign it a medium priority. This change does not really buy anything for this specific protocol group example, because the ip-option group only has two members contending for the aggregate. After all, a medium priority setting only matters when there is another member using low, given the strict priority that’s in effect when an individual packet type policer contends with other individual packet policers for access to the aggregate policer’s bandwidth. The high priority router alert messages can starve the unclassified group just as easily, regardless of whether it uses a medium or low priority. Note that in this example starvation is not possible because the group’s aggregate packet rate exceeds the individual rate allowed for IP optioned packets. Starvation will become an issue if the group’s aggregate had been set to only 5K, so pay attention to priority settings in relation to the aggregate rate for a given protocol type.
Verify DDoS operation
You now confirm the configured settings and expected operation using various forms of the show ddos-protection operational mode command:
{master}[edit]
jnpr@R1-RE0# run show ddos-protection ?
Possible completions:
  protocols            Show protocol information
  statistics           Show overall statistics
  version              Show version
{master}[edit]
jnpr@R1-RE0# run show ddos-protection
Most of the meat is obtained with the protocols switch, as demonstrated in the following. The version option displays info on DDoS version along with the number of classified protocols:
{master}[edit]
jnpr@R1-RE0# run show ddos-protection version
DDOS protection, Version 1.0
  Total protocol groups       = 98
  Total tracked packet types  = 220
The statistics option provides a quick summary of current DDoS state:
{master}[edit]
jnpr@R1-RE0# run show ddos-protection statistics
  Policing on routing engine:         Yes
  Policing on FPC:                    Yes
  Flow detection:                     No
  Logging:                            Yes
  Policer violation report rate:      100
  Flow report rate:                   100
  Currently violated packet types:    0
  Packet types have seen violations:  3
  Total violation counts:             290
  Currently tracked flows:            0
  Total detected flows:               0
The output shows that DDoS is enabled and that, while no current violations are in effect, historically 290 violations have occurred for three different packet types. In this example, let’s focus on the ip-options group and begin with the default parameters for this group:
{master}[edit]
jnpr@R1-RE0# run show ddos-protection protocols ip-options parameters brief
Packet types: 4, Modified: 0
* = User configured value

Protocol    Packet      Bandwidth Burst  Priority Recover   Policer  Bypass FPC
group       type        (pps)     (pkts)          time(sec) enabled  aggr.  mod
ip-opt      aggregate   20000     20000  --       300       yes      --     no
ip-opt      unclass..   10000     10000  Low      300       yes       no    no
ip-opt      rt-alert    20000     20000  High     300       yes       no    no
ip-opt      non-v4v6    10000     10000  Low      300       yes       no    no
The output confirms the group consists of an aggregate and three individual message types. The default values for bandwidth and burst are assigned, as are the individual priorities. You also see that neither individual message is allowed to bypass the aggregate and that the policers are enabled. The configuration is modified and the changes are confirmed:
{master}[edit]
jnpr@R1-RE0# show | compare
[edit system]
+   ddos-protection {
+       traceoptions {
+           file ddos_trace size 10m;
+           level info;
+           flag protocol;
+           flag events;
+       }
+       protocols {
+           ip-options {
+               aggregate {
+                   bandwidth 10000;
+                   burst 500;
+               }
+               unclassified {
+                   priority medium;
+               }
+               router-alert {
+                   bandwidth 5000;
+                   recover-time 150;
+                   priority high;
+               }
+           }
+       }
+   }

{master}[edit]
jnpr@R1-RE0# run show ddos-protection protocols ip-options parameters brief
Packet types: 4, Modified: 3
* = User configured value

Protocol    Packet      Bandwidth Burst  Priority Recover   Policer  Bypass FPC
group       type        (pps)     (pkts)          time(sec) enabled  aggr.  mod
ip-opt      aggregate   10000*    500*   --       300       yes      --     no
ip-opt      unclass..   10000     10000  Medium*  300       yes       no    no
ip-opt      rt-alert    5000*     20000  High*    150       yes       no    no
ip-opt      non-v4v6    10000     10000  Low      300       yes       no    no
The output confirms the changes have taken effect; note how any user-modified (non-default) value is called out with an “*” to help draw your attention to values that have been altered. Use the show ddos-protection protocols command to display current violation state, traffic statistics, and details on the aggregate and individual packet type policer information for all protocols, or for only a selected protocol group, the latter is shown by adding the protocol group’s keyword:
{master}[edit system ddos-protection]
jnpr@R1-RE0# run show ddos-protection protocols ip-options ?
Possible completions:
  <[Enter]>            Execute this command
  |                    Pipe through a command
  parameters           Show IP-Options protocol parameters
  statistics           Show IP-Options statistics and states
  violations           Show IP-Options traffic violations
  flow-detection       Show IP-Options flow detection parameters
  culprit-flows        Show IP-Options culprit flows
  aggregate            Show aggregate for all ip options traffic information
  unclassified         Show Unclassified options traffic information
  router-alert         Show Router alert options traffic information
  non-v4v6             Show Non IPv4/v6 options traffic information
{master}[edit system ddos-protection]
jnpr@R1-RE0# run show ddos-protection protocols ip-options
The system baseline is now examined to confirm no current violations and that there has been very little ICMP activity since this system was booted:
{master}[edit]
jnpr@R1-RE0# run show ddos-protection protocols ip-options violations
Number of packet types that are being violated: 0

{master}[edit]
jnpr@R1-RE0# run show ddos-protection protocols ip-options statistics brief
Packet types: 4, Received traffic: 0, Currently violated: 0

Protocol    Packet      Received        Dropped        Rate     Violation State
group       type        (packets)       (packets)      (pps)    counts
ip-opt      aggregate   1               0              0        0         ok
ip-opt      unclass..   0               0              0        0         ok
ip-opt      rt-alert    1               0              0        0         ok
ip-opt      non-v4v6    0               0              0        0         ok
Not only are the current traffic rate counters at 0, but the cumulative counter is also very low, with a single router alert IP optioned packet having been detected thus far. To see details on individual packet types include the related keyword:
{master}[edit]
jnpr@R1-RE0# run show ddos-protection protocols ip-options router-alert
Protocol Group: IP-Options

  Packet type: router-alert (Router alert options traffic)
    Individual policer configuration:
      Bandwidth:        5000 pps
      Burst:            20000 packets
      Priority:         high
      Recover time:     150 seconds
      Enabled:          Yes
      Bypass aggregate: No
    System-wide information:
      Bandwidth is never violated
      Received:  1                   Arrival rate:     0 pps
      Dropped:   0                   Max arrival rate: 0 pps
    Routing Engine information:
      Policer is never violated
      Received:  1                   Arrival rate:     0 pps
      Dropped:   0                   Max arrival rate: 0 pps
        Dropped by aggregate policer: 0
    FPC slot 1 information:
      Bandwidth: 100% (5000 pps), Burst: 100% (20000 packets), enabled
      Policer is never violated
      Received:  0                   Arrival rate:     0 pps
      Dropped:   0                   Max arrival rate: 0 pps
        Dropped by aggregate policer: 0
    FPC slot 2 information:
      Bandwidth: 100% (5000 pps), Burst: 100% (20000 packets), enabled
      Policer is never violated
      Received:  1                   Arrival rate:     0 pps
      Dropped:   0                   Max arrival rate: 0 pps
        Dropped by aggregate policer: 0
The output for the router alert individual packet policer confirms the system-wide settings and the policer statistics for both the RE and FPC hierarchies. Note that the first-stage Trio PFE-level stats are not displayed in the CLI, but violations are reported via the FPC housing that Trio PFE. PFE statistics are only available via the PFE command. Here, you confirm that the router alert packet was actually received by the PFE 0 of FPC 2:
jnpr@R1-RE0> start shell pfe network fpc2

NPC platform (1067Mhz MPC 8548 processor, 2048MB memory, 512KB flash)

NPC2(R1 vty)# show ddos policer ip-options stats
DDOS Policer Statistics:

idx prot   group       proto on     loc     pass      drop    rate   rate flows
 ---  --- -------  ---------- --  ------  -------   -------  ------ ------ -----
 132 3d00  ip-opt   aggregate  Y   UKERN   0         0       0      0     0
                                   PFE-0   0         0       0      0     0
                                   PFE-1   0         0       0      0     0
 133 3d01  ip-opt   unclass..  Y   UKERN   0         0       0      0     0
                                   PFE-0   0         0       0      0     0
                                   PFE-1   0         0       0      0     0
 134 3d02  ip-opt     rt-alert  Y   UKERN   1          0       0      0     0
                                    PFE-0   1          0       0      0     0
                                    PFE-1   0          0       0      0     0
 135 3d03  ip-opt     non-v4v6  Y   UKERN   0          0       0      0     0
                                    PFE-0   0          0       0      0     0
                                    PFE-1   0          0       0      0     0
With the information provided, you can quickly discern if there is currently excess router alert traffic, whether excess traffic has been detected in the past, and if so, the last violation start and end time. The per FPC displays include any alerts or violations that have been detected at either the Trio chipset or the FPC policing levels, information that allows you to quickly determine the ingress points for anomalous control plane traffic.
You cannot clear violation history except with a system reboot. You can clear a specific group’s statistics or clear a current violation state using the clear ddos-protection protocols command:
{master}[edit]
jnpr@R1-RE0# run clear ddos-protection protocols ip-options ?
Possible completions:
  statistics           Clear IP-Options statistics
  states               Reset IP-Options states
  culprit-flows        Cleart all culprit flows for IP-Options
  aggregate            Clear aggregate for all ip options traffic information
  unclassified         Clear Unclassified options traffic information
  router-alert         Clear Router alert options traffic information
  non-v4v6             Clear Non IPv4/v6 options traffic information
DDoS Case Study
This case study is designed to show the DDoS prevention feature in action. It begins with the modified configuration for the ip-options group discussed in the previous section. So far, no DDoS alerts or trace activity have been detected on R1, as evidenced by the lack of alerts in the system log files:
{master}

{master}
jnpr@R1-RE0> show log messages | match ddos

{master}
jnpr@R1-RE0> show log ddos_trace

{master}
jnpr@R1-RE0>
No real surprise, given the system’s lab setting and the lack of hostile intent in those who, having had the pleasure of using it, have developed somewhat affectionate feelings for the little chassis. At any extent, in the interest of moving things along, the author has agreed to use a router tester to target R1 with the proverbial boatload of IP optioned packets. After all, DDoS protection is in place so no routers should be harmed in the experiment. In this case, all the packets are coded with the infamous router alert—recall this option forces RE-level processing and thereby serves as a potential attack vector among the more shady characters that share our civilization.
Figure 4-3 shows the topology details for the DDoS protection lab.
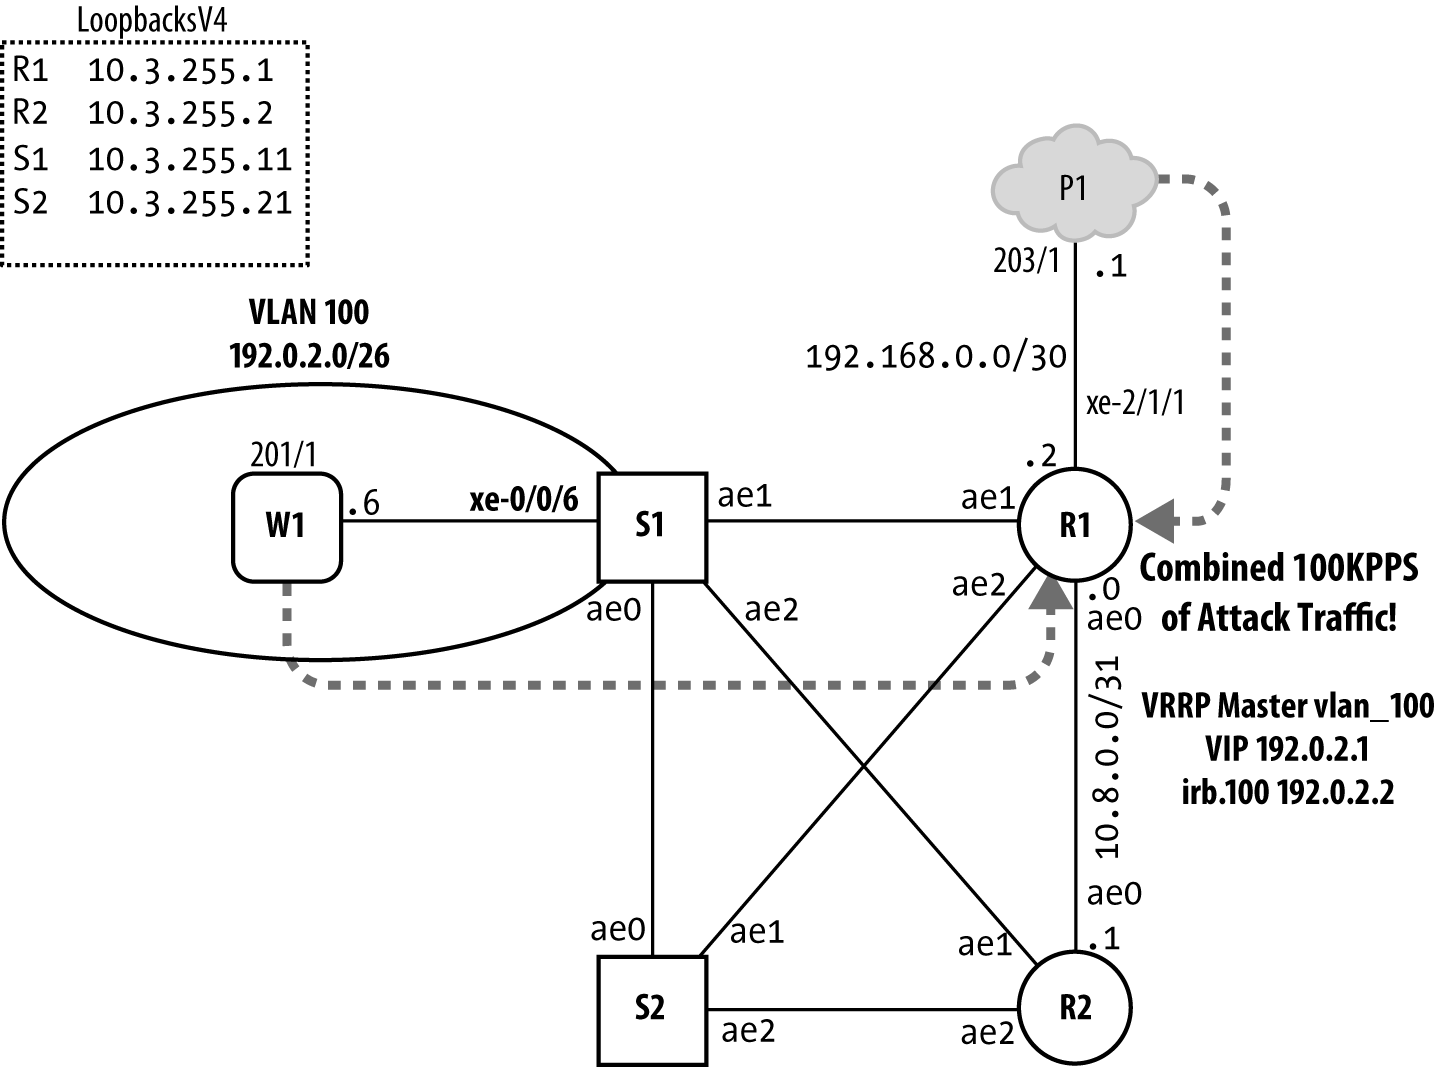
Figure 4-3. DDoS protection lab topology
The plan is to generate two identical streams of these black-hat-wearing packets, one via the xe-0/0/6 Layer 2 access interface at S1 and the other over the xe-2/1/1 Layer 3 interface connecting R1 to P1. Both packet streams are sent from IP address 192.0.2.20 and destined to the 192.0.2.3 address assigned to R2’s VLAN 100 IRB interface. Recall that the presence of the router-alert option forces R1 to examine this transit traffic even though it’s not addressed to one of its local IP addresses. The Ethernet frame’s destination MAC address is set to all 1’s broadcast, a setting that ensures copies of the same stream will be accepted for processing/routing on R1’s Layer 3 interface while also flooded in the VLAN 100 Layer 2 domain by S1. The packets are 128 bytes long at Layer 2 and are generated at 50,000 packets per second, for a combined load of 100 kpps.
That is a fair amount of traffic for an RE to process, each and every second. This could be dangerous, if not for DDoS protection!
The Attack Has Begun!
The stage is set, and the DDoS daemon is standing by, ready to take the best of whatever shot you can throw, so traffic generation is initiated.
Oh, the humanity . . . but wait, the router is still responsive, there is no meltdown. In fact, the only real indication that anything is amiss is the syslog entry from jddosd reporting the violation:
jnpr@R1-RE0> show log messages | match ddos
Dec 19 18:16:56  R1-RE0 jddosd[1541]: DDOS_PROTOCOL_VIOLATION_SET: Protocol
  IP-Options:router-alert is violated at fpc 2 for 1 times, started at
  2011-12-19 18:16:56 PST, last seen at 2011-12-19 18:16:56 PST
The syslog information flags you as to the nature of the attack traffic, as well as the affected FPC, in this case FPC 2. The same information is also found to be written to the DDoS trace file, which can be handy if someone has disabled DDoS logging globally, as the global disable logging statement only controls logging to the main syslog messages file, not to a DDoS-specific trace file:
{master}[edit]
jnpr@R1-RE0# run show log ddos_trace

Dec 19 18:16:56 Protocol IP-Options:router-alert is violated at fpc 2 for 1 times
  started at 2011-12-19 18:16:56 PST, last seen at 2011-12-19 18:16:56  PST
Analyze the nature of the DDoS threat
Once you are alerted that abnormal levels of control plane traffic have been detected, you can quickly narrow down the nature and scope of the anomaly using the following process.
First, confirm the violation state with a show ddos-protection statistics command:
{master}
jnpr@R1-RE0> show ddos-protection statistics
DDOS protection global statistics:
  Currently violated packet types:    1
  Packet types have seen violations:  1
  Total violation counts:             1
To display the scope of protocols currently involved, add the violations keyword:
{master}
jnpr@R1-RE0> show ddos-protection protocols violations
Number of packet types that are being violated: 1
Protocol    Packet      Bandwidth  Arrival   Peak      Policer bandwidth
group       type        (pps)      rate(pps) rate(pps) violation detected at
ip-opt      rt-alert    5000       100004    100054    2011-12-19 18:16:56 PST
          Detected on: FPC-2
With no other protocols in a violation state, and knowing it’s not just IP options but specifically router alerts that make up the attack, move on to display the details for that traffic type:
{master}
jnpr@R1-RE0> show ddos-protection protocols ip-options router-alert
Protocol Group: IP-Options

  Packet type: router-alert (Router alert options traffic)
    Individual policer configuration:
      Bandwidth:        5000 pps
      Burst:            20000 packets
      Priority:         high
      Recover time:     150 seconds
      Enabled:          Yes
      Bypass aggregate: No
    System-wide information:
      Bandwidth is being violated!
        No. of FPCs currently receiving excess traffic: 1
        No. of FPCs that have received excess traffic:  1
        Violation first detected at: 2011-12-19 18:16:56 PST
        Violation last seen at:      2011-12-19 18:19:33 PST
        Duration of violation: 00:02:37 Number of violations: 1
      Received:  15927672            Arrival rate:     100024 pps
      Dropped:   10402161            Max arrival rate: 100054 pps
    Routing Engine information:
      Policer is never violated
      Received:  374395              Arrival rate:     2331 pps
      Dropped:   0                   Max arrival rate: 2388 pps
        Dropped by aggregate policer: 0
    FPC slot 1 information:
      Bandwidth: 100% (5000 pps), Burst: 100% (20000 packets), enabled
      Policer is never violated
      Received:  0                   Arrival rate:     0 pps
      Dropped:   0                   Max arrival rate: 0 pps
        Dropped by aggregate policer: 0
    FPC slot 2 information:
      Bandwidth: 100% (5000 pps), Burst: 100% (20000 packets), enabled
      Policer is currently being violated!
        Violation first detected at: 2011-12-19 18:16:56 PST
        Violation last seen at:      2011-12-19 18:19:33 PST
        Duration of violation: 00:02:37 Number of violations: 1
      Received:  15927672            Arrival rate:     100024 pps
      Dropped:   10402161            Max arrival rate: 100054 pps
        Dropped by this policer: 10402161
        Dropped by aggregate policer: 0
The very fact that this output is obtained proves that R1 has remained responsive throughout the event, and thereby the effectiveness of the new Trio DDoS protection. Note how the stats for policing at the RE level show a peak load of only 2,388 pps, while the FPC 2 statistics confirm an arrival rate of 100,000 pps. And large numbers of drops are confirmed, which accounts for the difference in Trio/FPC policing load versus the volume of traffic that is actually making it to the RE.
The display also confirms that all of the bad traffic ingresses on FPC 2. Just knowing that can help you apply filters or other methods to begin tracking back to the point at which the bad traffic ingresses your network, so you can either disable the peering interface or apply a filter to block the traffic before it endangers your network.
It’s often helpful to display protocol group-level information, which also includes any individual packet policers, even when you know a specific violation is caught with an individual packet policer, such as the case with the router alert example being discussed. The group-level displays combined information from all five policing points, albeit in what can be a rather long display, which helps you identify Trio-level PFE policing actions from those in the FPC or RE. To best illustrate how the DDoS hierarchical policers work, the statistics and state from the last experiment are cleared:
{master}
jnpr@R1-RE0> clear ddos-protection protocols statistics
jnpr@R1-RE0> clear ddos-protection protocols state
And the traffic generator is altered to send one million router alert packets, at a 100 kpps rate, over a single interface. The round numbers should help make later analysis that much easier. After the traffic is sent, the protocol group-level DDoS policer information is displayed:
{master}
jnpr@R1-RE0> show ddos-protection protocols ip-options
Protocol Group: IP-Options

  Packet type: aggregate (Aggregate for all options traffic)
    Aggregate policer configuration:
      Bandwidth:        10000 pps
      Burst:            500 packets
      Priority:         high
      Recover time:     300 seconds
      Enabled:          Yes
    System-wide information:
      Aggregate bandwidth is never violated
      Received:  71751               Arrival rate:     0 pps
      Dropped:   0                   Max arrival rate: 6894 pps
    Routing Engine information:
      Aggregate policer is never violated
      Received:  40248               Arrival rate:     0 pps
      Dropped:   0                   Max arrival rate: 4262 pps
        Dropped by individual policers: 0
    FPC slot 1 information:
      Bandwidth: 100% (10000 pps), Burst: 100% (500 packets), enabled
      Aggregate policer is never violated
      Received:  0                   Arrival rate:     0 pps
      Dropped:   0                   Max arrival rate: 0 pps
        Dropped by individual policers: 0
    FPC slot 2 information:
      Bandwidth: 100% (10000 pps), Burst: 100% (500 packets), enabled
      Aggregate policer is never violated
      Received:  71751               Arrival rate:     0 pps
      Dropped:   31743               Max arrival rate: 6894 pps
        Dropped by individual policers: 31743

  Packet type: unclassified (Unclassified options traffic)
    Individual policer configuration:
      Bandwidth:        10000 pps
      Burst:            10000 packets
      Priority:         medium
      Recover time:     300 seconds
      Enabled:          Yes
      Bypass aggregate: No
    System-wide information:
      Bandwidth is never violated
      Received:  0                   Arrival rate:     0 pps
      Dropped:   0                   Max arrival rate: 0 pps
    Routing Engine information:
      Policer is never violated
      Received:  0                   Arrival rate:     0 pps
      Dropped:   0                   Max arrival rate: 0 pps
        Dropped by aggregate policer: 0
    FPC slot 1 information:
      Bandwidth: 100% (10000 pps), Burst: 100% (10000 packets), enabled
      Policer is never violated
      Received:  0                   Arrival rate:     0 pps
      Dropped:   0                   Max arrival rate: 0 pps
        Dropped by aggregate policer: 0
    FPC slot 2 information:
      Bandwidth: 100% (10000 pps), Burst: 100% (10000 packets), enabled
      Policer is never violated
      Received:  0                   Arrival rate:     0 pps
      Dropped:   0                   Max arrival rate: 0 pps
        Dropped by aggregate policer: 0

  Packet type: router-alert (Router alert options traffic)
    Individual policer configuration:
      Bandwidth:        5000 pps
      Burst:            20000 packets
      Priority:         high
      Recover time:     150 seconds
      Enabled:          Yes
      Bypass aggregate: No
    System-wide information:
      Bandwidth is being violated!
        No. of FPCs currently receiving excess traffic: 1
        No. of FPCs that have received excess traffic:  1
        Violation first detected at: 2011-12-19 19:00:43 PST
        Violation last seen at:      2011-12-19 19:00:53 PST
        Duration of violation: 00:00:10 Number of violations: 2
      Received:  1000000             Arrival rate:     0 pps
      Dropped:   819878              Max arrival rate: 100039 pps
    Routing Engine information:
      Policer is never violated
      Received:  40248               Arrival rate:     0 pps
      Dropped:   0                   Max arrival rate: 4262 pps
        Dropped by aggregate policer: 0
    FPC slot 1 information:
      Bandwidth: 100% (5000 pps), Burst: 100% (20000 packets), enabled
      Policer is never violated
      Received:  0                   Arrival rate:     0 pps
      Dropped:   0                   Max arrival rate: 0 pps
        Dropped by aggregate policer: 0
    FPC slot 2 information:
      Bandwidth: 100% (5000 pps), Burst: 100% (20000 packets), enabled
      Policer is currently being violated!
        Violation first detected at: 2011-12-19 19:00:43 PST
        Violation last seen at:      2011-12-19 19:00:53 PST
        Duration of violation: 00:00:10 Number of violations: 2
      Received:  1000000             Arrival rate:     0 pps
      Dropped:   819878              Max arrival rate: 100039 pps
        Dropped by this policer: 819878
        Dropped by aggregate policer: 0
There is a lot of information here; refer back to Figure 4-2 for a reminder on the five levels of DDoS policing that are possible, and let’s take it one step at a time.
The first stage of DDoS policing occurs at the Trio FPC level. The ingress Trio statistics are at the bottom of the display, under the Packet type: router-alert (Router alert options traffic) heading. The maximum arrival rate of 1,000,039 pps corresponds nicely with the traffic’s burst length and rate parameters, as does the received count of 1,000,000 packets. The display confirms that this policer is currently violated, and, importantly, shows that 819,878 packets have been dropped.
Recall that the goal of Junos DDoS protection is to first recognize when there is excessive control plane traffic and then to cut it off as close to the source and as far away from the RE as possible. The numbers confirm that over 80% of the excess traffic was discarded, and this in the first of as many as five policing stages. Clearly, DDoS has acted to preserve control plane resources farther up the line. With the drops shown at this stage, there should be some 180,122 options packets still making their way up north to the land of the RE.
The next step is the FPC policer, which for this group is a two-stage policer with individual- and aggregate-level policing. Its details are in the FPC slot 2 information under the aggregate (Aggregate for all options traffic) heading. Here is where you have to do some detective work. The display confirms that the FPC-level aggregate policer was never violated, but at the same time it shows 31,743 drops, which therefore had to come from its individual packet policer stage. The display also shows the FPC policing stage received only 71,751 packets, which is well short of the 180,122 that made it through the Trio PFE-level policer.
When asked about the discrepancy between DDoS stages, a software engineer confirmed the presence of “legacy policing functions that may also drop excess traffic on the host path,” for example, the built-in ICMP rate limiting function that is viewed with a show system statistics icmp command. The defaults can be altered via the set system internet-options configuration statement:
[edit]
jnpr@R4# set system internet-options icmpv?
Possible completions:
> icmpv4-rate-limit    Rate-limiting parameters for ICMPv4 messages
> icmpv6-rate-limit    Rate-limiting parameters for ICMPv6 messages
Here, the V4 options are shown:
[edit]
jnpr@R4# set system internet-options icmpv4-rate-limit ?
Possible completions:
  bucket-size          ICMP rate-limiting maximum bucket size (seconds)
  packet-rate          ICMP rate-limiting packets earned per second
[edit]
jnpr@R4# set system internet-options icmpv4-rate-limit
The moral of the story is you should not expect 100% correlation of the counters shown at the various policing stages, as this data only reflects actions associated with DDoS processing and not those of other host protection mechanisms that may continue to coexist. Recall the goal of the feature is to protect the RE while providing the operator with the information needed to ascertain the scope and nature of an attack, not to provide statistics suitable for usage-based billing.
The fact that the FPC’s aggregate policer was never violated is a testament to the effectiveness of the actions at the first stage. With the FPC showing receipt of 71,757 packets, and factoring the 31,743 discards, there should be about 40,014 packets left to make their way through the final policing stage in the RE itself.
The RE’s policer stats are shown in a few places. Looking at the one under the group aggregate, it’s possible to see it has received a total of 40,248 packets. The display also confirms no discards in the RE policer at either the individual or aggregate levels. The number is slightly higher than the 40,014 that were assumed to have left the FPC, perhaps due to some other legacy system function, but the numbers still mesh relatively well with the known nature of this attack. In the end, the fact that 1M of these puppies were sent while the RE only had to deal with 40K of them, all due to a hardware-based feature that has no forwarding performance impact, should really drive home the benefits of this Trio-only feature.
Suspicious Control Flow Detection
As previously noted, using ddos-protection is pretty straightforward but the complexity lies in the choice of policer values. Policing a given protocol or a specific packet type might be sufficient to protect the Routing Engine itself, but what about the need to protect one protocol itself? For example, most network operators would consider it unacceptable to permit the starvation/disruption of legitimate BGP as a result of a TCP SYN flood attack on the BGP port (179).
To address the need for more granular flow policing Juniper enhanced the initial DDoS protection feature with Suspicious Control Flow Detection (SCFD) to provide deeper analysis within a given protocol or packet-type. Unlike basic DDoS, SCFD is disabled by default; once enabled, flow protection monitors the specific contributors to the various aggregate flows and dynamically tries to determine those that are “hostile” by virtue of their accounting for the majority of the aggregate packet rate. Suspicious flows are tracked over a time window to log both when they are designated as suspicious, as well as noting when such flows return to acceptable limits. A suspect flow in violation of its configured rate can be dropped, policed, or forwarded based on configuration. The latter case does not provide any inherent protection over basic DDoS, but the identification and logging of flows that were found to be in violation can be useful for later analysis and possible subsequent DDoS tuning.
Warning
SCFD operates only at the PFE level, meaning on an LU or XL chip. The lookup chip maintains the flow hash table with the associated policers. By policing micro flows closer to their source, the goal is to preserve the aggregate rate at the FPC and RE levels for legitimate (nonsuspicious) traffic.
There are three levels of SCFD monitoring:
-
Subscriber This is the finest grained of the three levels. These flows are monitored at the lowest level of aggregation to monitor individual subscribers, as identified by a Network layer or MAC address.
-
Logicial-interface The logical interface level can represent the aggregation of several subscriber flows as a single IFL can be assigned multiple addresses—for example, an IPv4 as well as IPv6.
-
Physical-interface This flow represents the physical interface level (IFD) and is often the aggregation of multiple IFLs along with their subscribers.
SCFD Vocabulary
Before diving in, let’s get some basic terminology out of the way:
- A flow
Various packet header fields are taken by the lookup chip to generate a hash. A sequence of packets that generates the same hash is considered a flow.
- A normal flow
A normal flow has a bandwidth below its allowed rate. This rate is user configurable but has a default value that matches the DDOS protection bandwidth. To save state, normal flows are not tracked by the system unless you explicitly configure the monitoring mode to ON.
- A suspicious flow
A flow is flagged as suspicious when it has a rate above its allowed bandwidth. The suspicious flows are always tracked by the system.
- A culprit flow
This is a suspicious flow that has a rate consistently above its allowed bandwidth during at least a configurable window time (
flow-detect-time; default is 3 seconds).
SCFD monitoring can be turned on, off, or set to automatic (default) at each level. The default automatic mode has flow detection begin automatically after a violation of a DDoS protection policer is detected. In ON mode flows are always tracked by the system even if the rate is below the allowed bandwidth. This mode requires more memory and should be enabled only for troubleshooting or other targeted purposes.
When a flow arrives, flow detection checks whether the flow is already listed in a table of suspicious flows. A suspicious flow is one that exceeds the bandwidth allowed by default or configuration. If the flow is not in the table and the aggregation level flow detection mode is on, then flow detection lists the new flow in the table. If the flow is not in the table and the flow detection mode is automatic, flow detection checks whether this flow is suspicious.
A suspicious flow is always placed in the flow table. Those found to be not suspicious are reevaluated in a similar manner at the next higher level of aggregation that has flow detection enabled. If none of the higher levels have detection on, then the flow continues to the DDoS protection packet policer for action, where it can be passed or dropped.
When the initial check finds the flow already in the table, then the flow is dropped, policed, or kept, depending on the control mode setting for that aggregation level.
As mentioned, regardless of mode or level, the following three actions are available once a flow is marked as a culprit flow:
- Drop
The entire flow is dropped when it reaches the bandwidth limit.
- Police
The flow is policed based on the configured bandwidth at this level.
- Keep
A log is generated but the flow is forwarded on to the next layer (i.e., the FPC or RE aggregation level).
Configure Flow Detection
As noted previously, SCFD is disabled by default. The first step is to enable the flow detection feature:
[edit system ddos-protection]
jnpr@R1# set global flow-detection
Once enabled, flow detection is activated for all supported protocols. Recall that the default flow detection mode is automatic. To check flow detection activity use the following CLI command:
jnpr@R1> show ddos-protection statistics | match flow
  Flow detection:                     Yes
  Flow report rate:                   100
  Currently tracked flows:            34
  Total detected flows:               1564
In this case, 1564 flows have been detected by the flow detection mechanism, but of these only 34 flows are currently being tracked as suspicious. Again, only suspicious flows are tracked, and only culprit flows are acted upon. A given flow is marked as suspicious and added to the tracing table if it exceeds its allowed bandwidth. A suspicious flow is considered a culprit flow when its rate, at a given level, is consistently above its allowed bandwidth for a detect time period (3 seconds by default). A flow which does not exceed its configured or default flow rate for the detect time period is consider a false positive. Once a suspicious (in cases where monitoring mode is ON) or a culprit flow rate is below its bandwidth for the recovery time period (60 seconds by default), the SCFD declares the flow to be normal, and removes it from the culprit flows table.
You can configure flow detection parameters on a per-protocol or per-packet type basis, including disabling flow detection when desired. A simple example based on modifying flow detection parameters for the ICMP protocol is shown:
[edit system ddos-protection protocols icmp]
jnpr@R1# show
aggregate {
    flow-level-bandwidth {
        subscriber 10;
        logical-interface 100;
    }
    flow-level-detection {
        subscriber automatic;
        logical-interface on;
        physical-interface off;
    }
    flow-level-control {
        subscriber police;
        logical-interface police;
    }
}
The following CLI command summarizes the configuration:
jnpr@R1> show ddos-protection protocols icmp flow-detection
Packet types: 1, Modified: 1
* = User configured value

Protocol Group: ICMP

  Packet type: aggregate
    Flow detection configuration:
      Detection mode: Automatic  Detect time:  3 seconds
      Log flows:      Yes        Recover time: 60 seconds
      Timeout flows:  No         Timeout time: 300 seconds
      Flow aggregation level configuration:
        Aggregation level   Detection mode  Control mode  Flow rate
        Subscriber          Automatic*      Police*       10 pps*
        Logical interface   On*             Police*       100 pps*
        Physical interface  Off*            Drop          20000 pps
The output confirms that the flow detect time and recover timers were kept at their default values of 3 and 60 seconds, respectively (note the display flags user configured values with a “*” and no such indication is present for these parameters). The automatic detection mode is also confirmed for ICMP flows, which will be tracked when they reach 10 pps. While automatic is the default mode, this field still carries the “*” flag because it was explicitly set by the configuration in this case. In a similar fashion, the aggregated flow of the IFL (logical unit) is always monitored, in effect marking the IFL as permanently tracked by the system and therefore always being added to the tracked flows table.
You can also see that the physical interface monitoring is disabled (Off) and that both the subscriber and logical interface levels have the control mode modified from the default (drop) to police.
As a result of the configuration and when a DDoS violation is triggered, each source IP address attached to the interface can generate at most 10 pps. At the same time, each logical unit is policed to no more than 100 ICMP packets per second. It makes sense to have a higher IFL rate because in Junos an IFL can have multiple addresses assigned, and here such each address is limited to 10 pps while the aggregate for all addresses on the IFL is limited to 100 pps).
Given that IFD level flow detection is disabled, the DDoS policer values for ICMP are used to limit traffic over the interface itself. Depending on how many IFLs are provisioned over the interface, this may or may not be a good decision. On the one hand, you remove the memory overhead associated with flow detection at one of the three levels, but on the other hand, if you have a huge number of IFLs provisioned, each of which is able to send 100 pps, then it may be possible for the combined interface load to begin impacting on fair usage of the aggregate ICMP bandwidth at either the FPC or RE levels. Enabling flow detection at the IFD level also (as per the defaults) would alleviate such concerns given that the IFD could then be limited to a value bellow the aggregate DDoS policer rate that is shared by users on other IFDs attached to the same PFE or MPC.
Case Study: Suspicious Flow Detection
To illustrate the power of SCFD, let’s explore a simple case using the ARP protocol. In data centers (DCs), some routers are connected to switches and act as aggregation points for a large number of VLANs and the related subscribers, where they function as gateways between Layer 2 switching in the DC and the Layer 3 routing used over WANs. A common failure mode in switched Layer 2 networks is referred to as a broadcast storm. Such storms arise from the basic fact that switches must flood unknown destination MACs, and broadcast can never be known, and so is always flooded. If the network permits loops to form than a single flooded broadcast frame can quickly multiply as it keeps looping until it literally crashes the network due to bandwidth exhaustion. Recall there is no time to live (TTL) mechanism at Layer 2, which makes loops particularly painful in a Layer 2 network.
Most switches and L2-focused routers support some form of storm control mechanism that is intended to mitigate against broadcast storms, but these mechanisms are based on disabling a L2 port after it is found to have excessive broadcast over some period of time. After a timeout, the port is typically re-enabled, and if the loop remains the process repeats. The problem is that during the time the storm is being detected, and each time it returns, it’s still possible for the excess traffic to have negative impact in the Layer 3 portions of your network.
As a result, even when storm control is deployed you may want to also secure routing nodes against this flooding. Let’s provide an example on how to accomplish this with an ARP protection case study.
First, recall that ARP is a Layer 2 protocol with no Network layer. As such, it isn’t processed by a lo0.0 firewall filter because such a filter is Layer 3 protocol family-based (i.e., inet or inet6). To address the need for ARP control, Junos provides three types of ARP policers:
Default per-PFE ARP policer
Configurable per-IFL (logical interface) ARP policer
DDoS ARP policer (hierarchical)/SCFD
The first policer type is a nonconfigurable and is applied by default in the input direction on Ethernet interfaces. This policer operates on a per-PFE basis and is named __default_arp_ policer. To check if a given interface has this policer applied, just use the following CLI command:
jnpr@R1> show interfaces policers xe-11/0/0
Interface       Admin Link Proto Input Policer         Output Policer
xe-11/0/0       up    up
xe-11/0/0.0     up    up
                           inet
                           multiservice __default_arp_policer__
It should be noted how the default policer’s bandwidth is set intentionally low, as seen the bandwidth is only 150Kbps combined with a modest burst size of only 15000 bytes. These values reflect the default ARP policer’s intended use on routed interfaces, which by their nature typically do not handle large volumes of ARP traffic. While the values are quite sufficient for core interfaces you may well find that when connected to a large Layer 2 network the defaults are too aggressive, which leads to performance degradation as legitimate ARP traffic is dropped forcing the related applications to timeout and retransmit.
A brief example of the second approach, configuring a per-IFL (logical interface) ARP policer with user-specified throughput values, is also shown for completeness (interested readers should refer to “Firewall Filter and Policer Overview” in Chapter 3 for details on this approach):
[edit interfaces ae1]
jnpr@R1# show
vlan-tagging;
aggregated-ether-options {
    link-speed 10g;
    lacp {
        active;
        periodic fast;
    }
}
unit 0 {
    vlan-id 100;
    family inet {
        policer {
            arp MY-POLICER-ARP;
        }
    }
}
jnpr@R1# show policer MY-POLICER-ARP
if-exceeding {
    bandwidth-limit 10m;
    burst-size-limit 64k;
}
then discard;
The sample IFL-based ARP policer provides ARP policing on a per-VLAN basis. While this approach does address the need for user configurable policing rates, as well as the problem of excessive traffic on one VLAN being able to affect others, it does nothing to preserve bandwidth among users that share the same VLAN! What if you also need to protect users within the same VLAN from being impacted by excess traffic? To protect against an ARP-based DDoS attack within a VLAN, the answer is SCFD!
To better illustrate how DDoS policing and SCFD work together to solve both the intra-VLAN as well as inter-VLAN protection problem, the configuration keeps the specific per-IFL ARP policer. The value of this policer is kept relatively high to illustrate inter-VLAN protection through the SCFD feature.
To some, keeping the default per-IFL ARP policer in place may strike as odd, given the goal is to focus on DDoS protection. This is done because the per-PFE ARP policer occurs in the input processing chain before the DDoS feature. Hence by setting it to a high value, we preserve default processing while also ensuring it does not interfere with the SCFD demonstration.
The sample SCFD topology is depicted in Figure 4-4.
Figure 4-4. SCFD study case topology
Consider a router, R1, connected to a switch via interface ae1. The interface in turn has three logical units defined to function as Layer 3 endpoints for each of three VLANs (100, 200, 300). Within each VLAN, there are five end users (subscribers).
The case study requirements for ARP policing and protection are as follows:
Each subscriber can generate at most 50 pps of ARP traffic within a VLAN.
Each VLAN is constrained to 200 pps of ARP traffic.
A physical port which trunks several VLANs is limited to 1000 pps of ARP.
Excess ARP traffic cannot affect users in the same or other VLANs.
SCFD and subsequent rate limiting should act on all flows regardless of their DDoS violation status. In other words, the SCFD mode should be set to ON.
The configuration for interface ae1 is shown:
[edit interfaces ae1]
jnpr@R1# show
vlan-tagging;
aggregated-ether-options {
    link-speed 10g;
    lacp {
        active;
        periodic fast;
    }
}
unit 100 {
    vlan-id 100;
    family inet {
        policer {
              arp MY-POLICER-ARP;
        }
        address 172.16.39.9/28;
    }
}
unit 200 {
    vlan-id 200;
    family inet {
        policer {
              arp MY-POLICER-ARP;
        }
        address 172.16.40.9/28;
    }
}
unit 300 {
    vlan-id 300;
    family inet {
        policer {
              arp MY-POLICER-ARP;
        }
        address 172.16.41.9/28;
    }
}
Traffic is generated for all customers on all VLANs. In this case each customer sends 200 pps of ARP request traffic. The result is that each VLAN receives 1,000 pps, which in turn results in a total ARP request load of 3,000 pps on the physical interface.
Note that, at this time, flow protection is disabled and the default DDoS ARP policer settings are in place. The default high pps rates for the DDoS policer means that no ARP rate limiting is in effect; you therefore expect to receive the full 3,000 pps of ARP request traffic. We confirm this theory by first examining the DDoS ARP statistics:
jnpr@R1> show ddos-protection protocols arp statistics terse
Packet types: 1, Received traffic: 1, Currently violated: 0

Protocol    Packet      Received        Dropped        Rate     Violation State
group       type        (packets)       (packets)      (pps)    counts
arp         aggregate   69705           0              3000     0         ok
The display confirms the expected 3,000 pps ARP load. Next, you look at the physical interface statistics:
 jnpr@R1> show interfaces ae1 | match rate
  Input rate     : 1440752 bps (2999 pps)
  Output rate    : 1250256 bps (3005 pps)
As expected the full ARP load of 3,000 pps is present on the interface. Of equal significance is that the router is observed to be answering all of the ARP requests, as indicated by the matched input and output packet rates. Considering how each ARP reply consumes internal bandwidth and CPU power, it’s clear how a broadcast loop of ARP request traffic could potentially lead to resource starvation that could affect other protocols also running on the router.
As shown previously, logical interface policers could be used to limit the ARP load per VLAN, and by extension per interface, but this approach does not protect a user’s fair share of the allowed ARP traffic within their VLAN, the latter being a requirement in this case study. To prevent excessive ARP while also protecting a user’s fair share of ARP within a single VLAN the best approach is to enable ARP flow detection. Note it’s the flow detection part that functions to protect users within a common VLAN, while the DDoS functionality works to limit the aggregate ARP load on a PFE, MPC, and RE basis. In this example the default ARP DDoS hierarchal policers are left in place with the focus on how VLANs are protected with flow detection. The modified DDoS stanza is shown:
edit system ddos-protection]
jnpr@R1# show
global {
    flow-detection;
}
protocols {
    arp {
        aggregate {
            flow-detection-mode on;
            flow-level-bandwidth {
                subscriber 50;
                logical-interface 200;
                physical-interface 1000;
            }
            flow-level-detection {
                subscriber on;
                logical-interface on;
                physical-interface on;
            }
            flow-level-control {
                subscriber police;
                logical-interface police;
                physical-interface police;
            }
            no-flow-logging;
        }
    }
}
Of significance here is that flow detection is enabled globally when the ARP aggregate flow detection mode is on, which means that ARP flows are always listed in the suspicious flows table and flow control (here “police”) works in every instance (even if the DDoS ARP policer does not trigger a violation). Remember that the ARP DDoS policer has a default allowed bandwidth of 20 kpps:
jnpr@R1# show ddos-protection protocols arp parameters
Packet types: 1, Modified: 0
* = User configured value

Protocol Group: ARP

  Packet type: aggregate (Aggregate for all arp traffic)
    Aggregate policer configuration:
      Bandwidth:        20000 pps
      Burst:            20000 packets
      Recover time:     300 seconds
      Enabled:          Yes
    Routing Engine information:
      Bandwidth: 20000 pps, Burst: 20000 packets, enabled
    FPC slot 0 information:
      Bandwidth: 100% (20000 pps), Burst: 100% (20000 packets), enabled
The flow bandwidth settings are defined at each level in accordance with the case study, and individual ARP flow detection and policing is enabled at all levels. After the change is committed, the CLI is used to confirm ARP flow detection is active:
jnpr@R1> show ddos-protection protocols arp flow-detection
Packet types: 1, Modified: 1
* = User configured value

Protocol Group: ARP

  Packet type: aggregate
    Flow detection configuration:
      Detection mode: On*        Detect time:  3 seconds
      Log flows:      No*        Recover time: 60 seconds
      Timeout flows:  No         Timeout time: 300 seconds
      Flow aggregation level configuration:
        Aggregation level   Detection mode  Control mode  Flow rate
        Subscriber          On*      Police*       50 pps*
        Logical interface   On*      Police*       200 pps*
        Physical interface  On*      Police*       1000 pps*
Now let’s have a look at the SCFD feature in action. We begin with a look at the ae1 statistics for a high-level view of what is happening:
jnpr@R1> show interfaces ae100 | match rate
  Input rate     : 1441408 bps (3000 pps)
  Output rate    : 250208 bps (601 pps)
Awesome! The interface’s output rate is now 600 pps. This confirms that the physical interface threshold (1 kpps) is no longer being exceeded, and the output rate correctly represents the allowed sum of 200 pps for each of the 3 VLANs. This indirectly confirms that the received ARP load has been rate limited by SCFD in accordance to the stated requirements.
Next, we peer deeper into SCFD to see if any culprit flows are reported. Remember that in this example we expect culprit flows because each customer is generating 200 pps of traffic, a value well in excess of the allowed 50 pps:
jnpr@R1> show ddos-protection protocols culprit-flows
Currently tracked flows: 19, Total detected flows: 20

Protocol    Packet      Arriving         Source Address
group       type        Interface        MAC or IP
arp         aggregate   ae100.200        -- -- --
   ifl:0013000000000000 2015-10-22 17:22:08 CEST pps:250  pkts:8257
arp         aggregate   ae100.300        -- -- --
   ifl:0013000000000001 2015-10-22 17:22:08 CEST pps:250  pkts:8257
arp         aggregate   ae100.300        00:00:CC:CC:CC:C4
   sub:0013000000000002 2015-10-22 17:22:08 CEST pps:199  pkts:5539
arp         aggregate   ae100.100        -- -- --
   ifl:0013000000000003 2015-10-22 17:22:08 CEST pps:250  pkts:8257
arp         aggregate   ae100.200        00:00:BB:BB:BB:B5
   sub:0013000000000005 2015-10-22 17:22:08 CEST pps:199  pkts:5539
arp         aggregate   ae100.200        00:00:BB:BB:BB:B4
   sub:0013000000000006 2015-10-22 17:22:08 CEST pps:199  pkts:5539
arp         aggregate   ae100.300        00:00:CC:CC:CC:C5
   sub:0013000000000007 2015-10-22 17:22:08 CEST pps:199  pkts:5539
arp         aggregate   ae100.100        00:00:AA:AA:AA:A6
   sub:0013000000000008 2015-10-22 17:22:08 CEST pps:199  pkts:5539
arp         aggregate   ae100.100        00:00:AA:AA:AA:A5
   sub:0013000000000009 2015-10-22 17:22:08 CEST pps:200  pkts:5540
arp         aggregate   ae100.100        00:00:AA:AA:AA:A0
   sub:001300000000000a 2015-10-22 17:22:08 CEST pps:199  pkts:5539
arp         aggregate   ae100.300        00:00:CC:CC:CC:C7
   sub:001300000000000b 2015-10-22 17:22:08 CEST pps:200  pkts:5540
arp         aggregate   ae100.200        00:00:BB:BB:BB:B6
   sub:001300000000000c 2015-10-22 17:22:08 CEST pps:200  pkts:5540
arp         aggregate   ae100.200        00:00:BB:BB:BB:B0
   sub:001300000000000d 2015-10-22 17:22:08 CEST pps:200  pkts:5540
arp         aggregate   ae100.100        00:00:AA:AA:AA:A7
   sub:001300000000000e 2015-10-22 17:22:08 CEST pps:200  pkts:5539
arp         aggregate   ae100.200        00:00:BB:BB:BB:B7
   sub:001300000000000f 2015-10-22 17:22:08 CEST pps:200 The display  pkts:5540
arp         aggregate   ae100.300        00:00:CC:CC:CC:C6
   sub:0013000000000010 2015-10-22 17:22:08 CEST pps:200  pkts:5540
arp         aggregate   ae100.300        00:00:CC:CC:CC:C0
   sub:0013000000000011 2015-10-22 17:22:08 CEST pps:200  pkts:5540
arp         aggregate   ae100.100        00:00:AA:AA:AA:A4
   sub:0013000000000012 2015-10-22 17:22:08 CEST pps:200  pkts:5540
arp         aggregate   ae61             -- -- --
   ifd:0013000000000013 2015-10-22 17:23:11 CEST pps:597  pkts:1197
The output confirms that culprit flows are being detected. The real-time pps rate shown for each level (subscriber, IFL/VLAN, and IFD) is the actual arrival rate before any policing. Note that the subscriber level is prefixed with the keyword “sub,” and the IFL level with the prefix “ifl,” and the interface level with the prefix “ifd.”
Notice how the subscriber level flows are tracked. In this case, the Layer 2 nature of ARP requires flow tracking be done based on the source MAC. Recall there is no IP layer/source IP address in an ARP request so the MAC is used to uniquely identify each subscriber/customer:
arp         aggregate   ae100.200        00:00:BB:BB:BB:B5
   sub:0013000000000005 2015-10-22 17:22:08 CEST pps:199  pkts:5539

arp         aggregate   ae100.200        -- -- --
   ifl:0013000000000000 2015-10-22 17:22:08 CEST pps:250  pkts:8257

arp         aggregate   ae61             -- -- --
   ifd:0013000000000013 2015-10-22 17:23:11 CEST pps:597  pkts:1197
The astute reader may be asking themselves why the pps rates at the IFL and IFD level don’t match the total load being generated by the related subscribers; recall each IFL has five users that each send 200 pps. Given these numbers, one might expect to see an IFL load of 1,000 pps rather than the 250 pps shown. The same could be said at the IFD level, where you might expect 3,000 pps rather than the 597 shown; after all, it’s supporting three IFLs, each at a theoretical 1,000 pps, right?
The answer to this mystery is that the subscriber flows have already been rate limited before being factored into the IFL load. The result is that each IFL/VLAN sees a total load of only 250 pps. In a similar fashion, the IFLs are rate limited before they are factored into the IFD load. The three rate-limited IFLs, each at 200 pps, combine at the IFD for a rate of 600 pps.
The result is that no ARP policing is needed at the IFD level in this example. Given the DDoS policers are left at their defaults, no additional policing is expected. This means that 600 pps of ARP requests are allowed to be processed by the line card/Routing Engine; as a result, the maximum ARP reply rate for this interface is limited to 600 pps, with each IFL getting a guaranteed 200 pps of ARP capacity, and each IFL user in turn being granted 50 pps.
Suspicious Control Flow Detection Summary
The SCFD feature is disabled by default. It works in conjunction with classical DDoS feature to dynamically identify and then as needed police individual flows to help preserve fair access to aggregate packet flows. When combined with DDoS policers that provide system-level protection, the result is both a stable platform and fair access to limited bandwidth, even in the presence of a DDoS attack.
Mitigate DDoS Attacks
Once you have analyzed the nature of a DDoS violation, you will know what type of traffic is involved and on which PFEs and line cards/FPCs the traffic is arriving. Armed with this information, you can manually begin deployment of stateless filters on the upstream nodes until you reach the border of your network where you can disable the offending peer or apply a filter to discard or rate limit the offending traffic as close to its source as possible. Once the fire is out, so to speak, you can contact the administrators of the peering network to obtain their assistance in tracing the attack to the actual sources/ingress points, where corrective actions can be taken.
BGP Flow-Specification to the Rescue
The Junos BGP flow-specification (flow-spec or flow route) feature uses MP-BGP to rapidly deploy filter and policing functionality among BGP speaking nodes on both an intra- and inter-Autonomous System basis. This feature is well suited to mitigating the effects of a DDoS attack, both locally and potentially over the global Internet, once the nature of the threat is understood. A flow specification is an n-tuple filter definition consisting of various IPv4 match criteria and a set of related actions that is distributed via MP-BGP so that remote BGP speakers can dynamically install stateless filtering and policing or offload traffic to another device for further handling. A given IP packet is said to match the defined flow if it matches all the specified criteria. Flow routes are an aggregation of match conditions and resulting actions for matching traffic that include filtering, rate limiting, sampling, and community attribute modification. Using flow-spec, you can define a filter once, and then distribute that filter throughout local and remote networks—just the medicine needed to nip a DDoS attack as close to the bud as possible.
Unlike BGP-based Remote Triggered Black Holes (RTBH), flow-spec gives you the ability to match on a wide range of match criteria, rather than policy-based matches that are destination IP address–based. And again, with flow-spec you can centralize and define match and filtering conditions and then use BGP to push that information out to both internal and external BGP speakers.
BGP flow-specification network-layer reachability information (NLRI) and its related operation are defined in RFC 5575, “Dissemination of Flow Specification Rules.” Note that Juniper publications still refer to the previous Internet draft, “draft-ietf-idr-flow-spec-09,” which relates to the same functionality. In operation, a flow-spec’s filter match criteria are encoded within the flow-spec NLRI, whereas the related actions are encoded in extended communities. Different NLRI are specified for IPv4 versus Layer 3 VPN IPv4 to accommodate the added route-distinguisher and route targets. Once again, the venerable warhorse that is BGP shows its adaptability. A new service is enabled through opaque extensions to BGP, which allows operators to leverage a well-understood and proven protocol to provide new services or enhanced security and network robustness, as is the case with flow-spec. Flow-spec information is said to be opaque to BGP because its not BGP’s job to parse or interpret the flow-spec payload. Instead, the flow-spec information is passed through the flow-spec validation module, and when accepted, is handed to the firewall daemon (dfwd) for installation into the PFEs as a stateless filter and/or policer.
In v14.2, Junos supports flow-spec NLRI for both main instance IPv4 unicast and Layer 3 VPN IPv4 unicast traffic. To enable flow-specification NLRI for main instance MP-BGP, you include the flow statement for the inet address family at the [edit protocols bgp group group-name family inet] hierarchy. To enable flow-specification NLRI for the inet-vpn address family, include the flow statement at the [edit protocols bgp group group-name family inet-vpn] hierarchy level. Note that the flow family is valid only for main instance MP-BGP sessions; you cannot use this family for a BGP session within a VRF.
Local and received flow routes that pass validation are installed into the flow routing table instance-name.inetflow.0, where matching packets are then subjected to the related flow-spec’s actions. Flow routes that do not pass validation are hidden in the related table null preference. Any change in validation status results in immediate update to the flow route. Received Layer 3 VPN flow routes are stored in the bgp.invpnflow.0 routing table and still contain their route distinguishers (RD). Secondary routes are imported to one or more specific VRF tables according to vrf-import policies. Unlike the inet flow NLRI, inet-vpn flow routes are not automatically validated against a specific VRF’s unicast routing information; this is because such an operation must be performed within a specific VRF context, and based on route-target the same flow NLRI can be imported into multiple VRFs.
Configure local flow-spec routes
You configure a local flow-specification for injection into BGP at the routing-options hierarchy, either in the main instance or under a supported instance type (VRF or VR). While some form of IDS may be used to provide alerts as to the need for flow-spec, in many cases operators will use SNMP alarms, RE protection filters, or the new DDoS feature to provide notification of abnormal traffic volumes. Using the details provided by these features allows the operator to craft one or more flow-specs to match on the attack vector and either filter outright or rate limit as deemed appropriate.
Flow-spec syntax is very much like a stateless filter; the primary difference is lack of a term function, as flow-specs consist of a single term. Otherwise, just like a filter, the flow-spec consists of a set of match criteria and related actions. As before, a match is only declared when all criteria in the from statement are true, else processing moves to the next flow-specification. The options for flow definition are displayed:
{master}[edit routing-options flow]
jnpr@R1-RE0# set ?
Possible completions:
+ apply-groups         Groups from which to inherit configuration data
+ apply-groups-except  Don't inherit configuration data from these groups
> route                Flow route
  term-order           Term evaluation order for flow routes
> validation           Flow route validation options
{master}[edit routing-options flow]
jnpr@R1-RE0# set
The term-order keyword is used to select between version 6 and later versions of the flow-spec specification, as described in the next section. Validation of flow routes, a process intended to prevent unwanted disruption from a feature that is intended to minimize disruption, is an important concept. It too is detailed in a following section. Currently, the validation keyword at the [edit routing-options flow] hierarchy is used to configure tracing for the validation process.
Supported match criteria include:
{master}[edit routing-options flow]
jnpr@R1-RE0# set route test ?
Possible completions:
  <[Enter]>            Execute this command
+ apply-groups         Groups from which to inherit configuration data
+ apply-groups-except  Don't inherit configuration data from these groups
> match                Flow definition
> then                 Actions to take for this flow
  |                    Pipe through a command
{master}[edit routing-options flow]
jnpr@R1-RE0# set route test match ?
Possible completions:
+ apply-groups         Groups from which to inherit configuration data
+ apply-groups-except  Don't inherit configuration data from these groups
  destination          Destination prefix for this traffic flow
+ destination-port     Destination TCP/UDP port
+ dscp                 Differentiated Services (DiffServ) code point (DSCP)
+ fragment
+ icmp-code            ICMP message code
+ icmp-type            ICMP message type
+ packet-length        Packet length
+ port                 Source or destination TCP/UDP port
+ protocol             IP protocol value
  source               Source prefix for this traffic flow
+ source-port          Source TCP/UDP port
+ tcp-flags            TCP flags
{master}[edit routing-options flow]
jnpr@R1-RE0# set route test match
And the supported actions:
{master}[edit routing-options flow]
jnpr@R1-RE0# set route test then ?
Possible completions:
  accept               Allow traffic through
+ apply-groups         Groups from which to inherit configuration data
+ apply-groups-except  Don't inherit configuration data from these groups
  community            Name of BGP community
  discard              Discard all traffic for this flow
  next-term            Continue the filter evaluation after matching this flow
  rate-limit           Rate to limit traffic for this flow (9600..1000000000000)
  routing-instance     Redirect to instance identified via Route Target community
  sample               Sample traffic that matches this flow
{master}[edit routing-options flow]
jnpr@R1-RE0# set route test then
A sample flow-specification is shown:
{master}[edit routing-options flow]
jnpr@R1-RE0# show
route flow_http_bad_source {
    match {
        source 10.0.69.0/25;
        protocol tcp;
        port http;
    }
    then {
        rate-limit 10k;
        sample;
    }
}
After the filter chapter, the purpose of the flow_http_bad_source flow-specification should be clear. Once sent to a remote peer, you can expect matching HTTP traffic to be rate limited and sampled (according to its sampling parameters, which are not shown here).
Flow-spec algorithm version
With BGP flow-spec, it’s possible that more than one rule may match a particular traffic flow. In these cases, it’s necessary to define the order at which rules get matched and applied to a particular traffic flow in such a way that the final ordering must not depend on the arrival order of the flow-specification’s rules and must be constant in the network to ensure predictable operation among all nodes.
Junos defaults to the term-ordering algorithm defined in version 6 of the BGP flow-specification draft. In Junos OS Release v10.0 and later, you can configure the router to comply with the term-ordering algorithm first defined in version 7 of the BGP flow specification and supported through RFC 5575, “Dissemination of Flow Specification Routes.” The current best practice is to configure the version 7 term-ordering algorithm. In addition, it’s recommended that the same term-ordering version be used on all routing instances configured on a given router.
In the default term ordering algorithm (draft version 6), a term with less specific matching conditions is always evaluated before a term with more specific matching conditions. This causes the term with more specific matching conditions to never be evaluated. Draft version 7 made a revision to the algorithm so that the more specific matching conditions are evaluated before the less specific matching conditions. For backward compatibility, the default behavior is not altered in Junos, even though the newer algorithm is considered better. To use the newer algorithm, include the term-order standard statement in the configuration.
Validating flow routes
Junos installs flow routes into the flow routing table only if they have been validated using the validation procedure described in draft-ietf-idr-flow-spec-09.txt, “Dissemination of Flow Specification Rules.” The validation process ensures the related flow-spec NLRI is valid and goes on to prevent inadvertent DDoS filtering actions by ensuring that a flow-specification for a given route is only accepted when it is sourced from the same speaker that is the current selected active next-hop for that route. Specifically, a flow-specification NLRI is considered feasible if and only if:
The originator of the flow-specification matches the originator of the best-match unicast route for the destination prefix embedded in the flow-specification.
There are no more specific unicast routes, when compared with the flow destination prefix, that have been received from a different neighboring AS than the best-match unicast route, which has been determined in the first step.
The underlying concept is that the neighboring AS that advertises the best unicast route for a destination is allowed to advertise flow-spec information for that destination prefix. Stated differently, dynamic filtering information is validated against unicast routing information, such that a flow-spec filter is accepted if, and only if, it has been advertised by the unicast next-hop that is advertising the destination prefix and there are no unicast routes more specific than the flow destination, with a different next-hop AS number. Ensuring that another neighboring AS has not advertised a more specific unicast route before validating a received flow-specification ensures that a filtering rule affects traffic that is only flowing to the source of the flow-spec and prevents inadvertent filtering actions that could otherwise occur. The concept is that, if a given routing peer is the unicast next-hop for a prefix, then the system can safely accept from the same peer a more specific filtering rule that belongs to that aggregate.
You can bypass the validation process and use your own import policy to decide what flow-spec routes to accept using the no-validate switch:
[protocols bgp group <name>]
family inet {
    flow {
    no-validate <policy-name>;
    }
}
Bypassing the normal validation steps can be useful in the case where there is one system in the AS in charge of advertising filtering rules that are derived locally, perhaps via an Intrusion Detection System (IDS). In this case, the user can configure a policy that, for example, accepts BGP routes with an empty as-path to bypass the normal validation steps.
In addition, you can control the import and export of flow routes through import and export policy statements, respectively, which are applied to the related BGP peering sessions in conventional fashion. These policies can match on various criteria to include route-filter statements to match against the destination address of a flow route and the ability to use a from rib inetflow.0 statement to ensure that only flow-spec routes can be matched. You can apply forwarding table export policy to restrict flow route export to the PFE. The default policy is to advertise all locally defined flow routes and to accept for validation all received flow routes.
You can confirm the validation status of a flow route with a show route detail command. In this, a Layer 3 VPN flow route is shown:
. . .
vrf-a.inetflow.0: 2 destinations, 2 routes (2 active, 0 holddown, 0 hidden)
10.0.1/24,*,proto=6,port=80/88 (1 entry, 1 announced)
        *BGP    Preference: 170/-101
                Next-hop reference count: 2
                State: <Active Ext>
                Peer AS: 65002
                Age: 3:13:32
                Task: BGP_65002.192.168.224.221+1401
                Announcement bits (1): 1-BGP.0.0.0.0+179
                AS path: 65002 I
                Communities: traffic-rate:0:0
                Validation state: Accept, Originator: 192.168.224.221
                Via: 10.0.0.0/16, Active
                Localpref: 100
                Router ID: 201.0.0.6
In the output, the Validation state field confirms the flow route was validated (as opposed to rejected) and confirms the originator of the flow route as IP address 192.168.224.221. The via: field indicates which unicast route validated the flow-spec route, which in this case was 10.0/16. Use the show route flow validation command to display information about unicast routes that are used to validate flow-specification routes.
You can trace the flow-spec validation process by adding the validation flag at the [edit routing-options flow] hierarchy:
{master}[edit routing-options flow]
jnpr@R1-RE0# show
validation {
    traceoptions {
        file flow_trace size 10m;
        flag all detail;
    }
}
Limit flow-spec resource usage
Flow-spec routes are essentially firewall filters, and like any filter there is some resource consumption and processing burden that can vary as a function of the filter’s complexity. However, unlike a conventional filter that requires local definition, once flow-spec is enabled on a BGP session, the remote peer is effectively able to cause local filter instantiation, potentially up until the point of local resource exhaustion, which can lead to bad things. To help guard against excessive resource usage in the event of misconfigurations or malicious intent, Junos allows you to limit the number of flow routes that can be in effect.
Use the maximum-prefixes statement to place a limit on the number of flow routes that can be installed in the inetflow.0 RIB:
set routing-options rib inetflow.0 maximum-prefixes <number>
set routing-options rib inetflow.0 maximum-prefixes threshold <percent>
To limit the number of flow-spec routes permitted from a given BGP peer, use the prefix-limit statement for the flow family:
set protocols bgp group x neighbor <address> family inet flow prefix-limit
  maximum <number>
set protocols bgp group x neighbor <address> family inet flow prefix-limit
  teardown <%>
What’s New in the World of Flow-Spec?
It’s expected that the 15.x and 16.x Junos releases will add additional flow-spec capabilities. For example:
Adding the capability to redirect the traffic to an IP next-hop. This can be useful for flow-spec based routing or to redirect specific traffic to an IP tunnel. This new “action” is currently described in draft-ietf-idr-flowspec-redirect-ip.txt, “BGP Flow-Spec Redirect to IP Action.” Currently, Junos only supports the redirect function in a VRF context.
Adding IPv6 support, as described in draft-ietf-idr-flow-spec-v6.txt, “Dissemination of Flow Specifcation Tools for IPv6.”
Providing interface index and direction information within the flow-spec. This allows for flow-specification rules that can be applied only on a specific subset of interfaces and only in a specific direction. This enhancement is currently defined in draft-litkowski-idr-flowspec-interfaceset.txt, “Applying BGP Flowspec Rules on a Specific Interface Set.”
The Junos BGP flow-specification feature is a powerful tool against DDoS attacks that works well alongside your Routing Engine protection filters and the Trio DDoS prevention feature. Even a hardened control plane can be overrun with excessive traffic that is directed to a valid service such as SSH. Once alerted to the anomalous traffic, you can use flow-spec to rapidly deploy filters to all BGP speakers to eliminate the attack traffic as close to the source as possible, all the while being able to maintain connectivity to the router to perform such mitigation actions, thanks to your having the foresight to deploy best practice RE protection filters along with built-in DDoS protections via Trio FPCs.
BGP Flow-Specification Case Study
This section provides a sample use case for the BGP flow-spec feature. The network topology is shown in Figure 4-5.
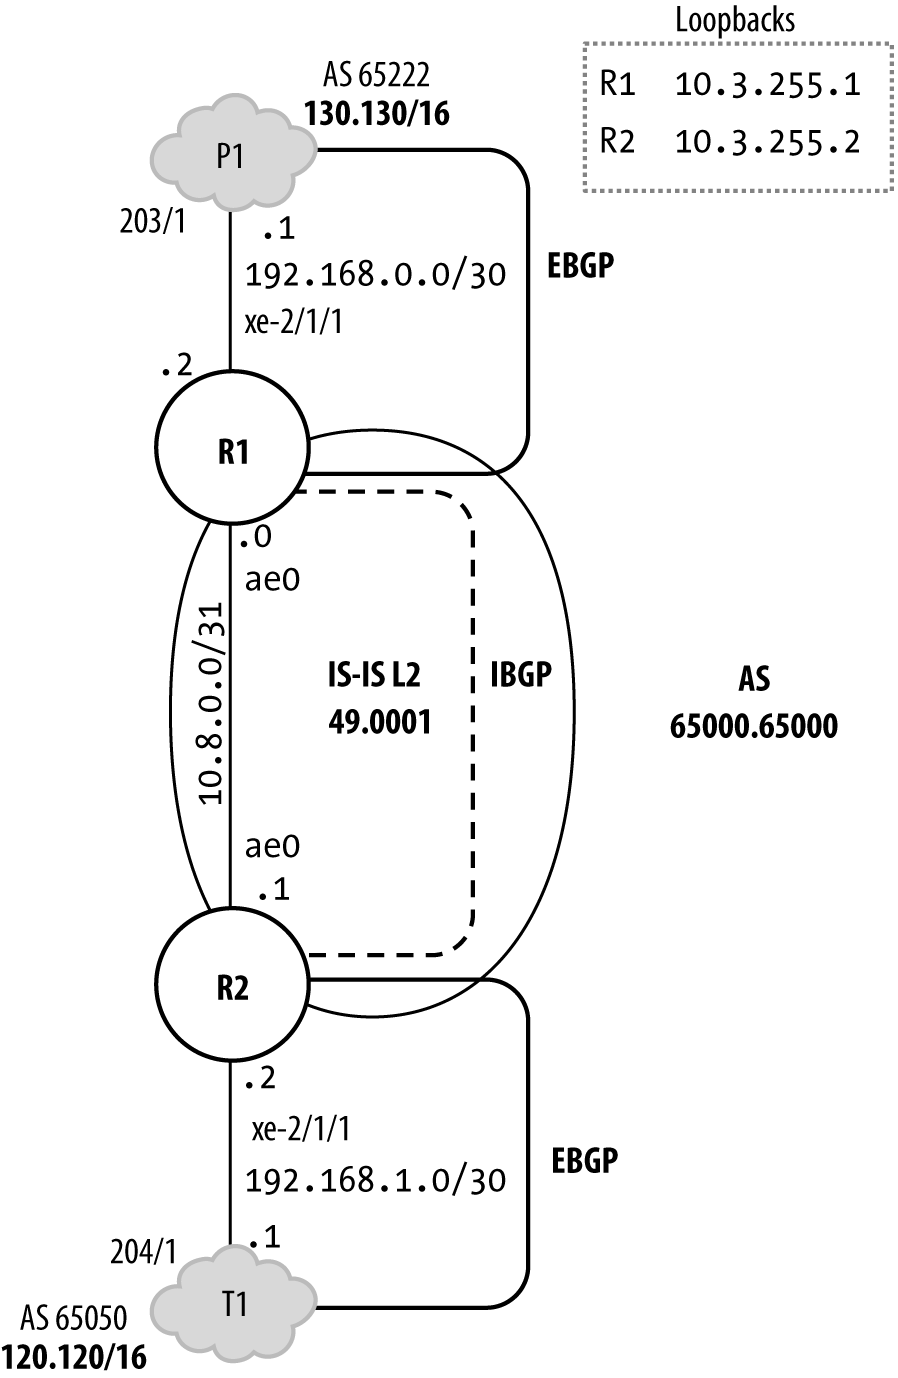
Figure 4-5. BGP flow-spec topology
Routers R1 and R2 have the best practice IPv4 RE protection filter previously discussed in effect on their loopback interfaces. The DDoS protection feature is enabled with the only change from the default being scaled FPC bandwidth for the ICMP aggregate. They peer with each other using loopback-based MP-IBGP, and to external peers P1 and T1 using EBGP. The P1 network is the source of routes from the 130.130/16 block, whereas T1 is the source of 120.120/16 routes. IS-IS Level 2 is used as the IGP. It runs passively on the external links to ensure the EBGP next-hops can be resolved. It is also used to distribute the loopback addresses used to support the IBGP peering. The protocols stanza on R1 is shown here:
{master}[edit]
jnpr@R1-RE0# show protocols
bgp {
    log-updown;
    group t1_v4 {
        type external;
        export bgp_export;
        peer-as 65050;
        neighbor 192.168.1.1;
    }
    group int_v4 {
        type internal;
        local-address 10.3.255.2;
        family inet {
            unicast;
            flow;
        }
        bfd-liveness-detection {
            minimum-interval 150;
            multiplier 3;
        }
        neighbor 10.3.255.1;
    }
}
isis {
    reference-bandwidth 100g;
    level 1 disable;
    interface xe-2/1/1.0 {
        passive;
    }
    interface ae0.1 {
        point-to-point;
        bfd-liveness-detection {
            minimum-interval 150;
            multiplier 3;
        }
    }
    interface lo0.0 {
        passive;
    }
}
lacp {
    traceoptions {
        file lacp_trace size 10m;
        flag process;
        flag startup;
    }
}
lldp {
    interface all;
}
layer2-control {
    nonstop-bridging;
}
vstp {
    interface xe-0/0/6;
    interface ae0;
    interface ae1;
    interface ae2;
    vlan 100 {
        bridge-priority 4k;
        interface xe-0/0/6;
        interface ae0;
        interface ae1;
        interface ae2;
    }
    vlan 200 {
        bridge-priority 8k;
        interface ae0;
        interface ae1;
        interface ae2;
    }
}
Note that flow NLRI has been enabled for the inet family on the internal peering session. Note again that BGP flow-spec is also supported for EBGP peers, which means it can operate across AS boundaries when both networks have bilaterally agreed to support the functionality. The DDoS stanza is displayed here:
{master}[edit]
jnpr@R2-RE0# show system ddos-protection
protocols {
    icmp {
        aggregate {
            fpc 2 {
                bandwidth-scale 30;
                burst-scale 30;
            }
        }
    }
}
The DDoS settings alter FPC slot 2 to permit 30% of the system aggregate for ICMP. Recall from the previous DDoS section that by default all FPCs inherit 100% of the system aggregate, which means any one FPC can send at the full maximum load with no drops, but also means a DDoS attack on any one FPC can cause contention at aggregation points for other FPCs with normal loads. Here, FPC 2 is expected to permit some 6,000 pps before it begins enforcing DDoS actions at 30% of the system aggregate, which by default is 20,000 pps in this release.
You next verify the filter chain application to the lo0 interface. While only R1 is shown, R2 also has the best practice IPv4 RE protection filters in place; the operation of the RE protection filter was described previously in the RE protection case study:
{master}[edit]
jnpr@R1-RE0# show interfaces lo0
unit 0 {
    family inet {
        filter {
            input-list [ discard-frags accept-sh-bfd accept-bgp accept-ldp
            accept-rsvp accept-telnet
            accept-common-services accept-vrrp discard-all ];
        }
        address 10.3.255.1/32;
    }
    family iso {
        address 49.0001.0100.0325.5001.00;
    }
    family inet6 {
        filter {
            input-list [ discard-extension-headers accept-MLD-hop-by-hop_v6
            deny-icmp6-undefined accept-sh-bfd-v6 accept-bgp-v6 accept-telnet-v6
            accept-ospf3 accept-radius-v6
            accept-common-services-v6 discard-all-v6 ];
        }
        address 2001:db8:1::ff:1/128;
    }
}
The IBGP and EBGP session status is confirmed. Though not shown, R2 also has both its neighbors in an established state:
{master}[edit]
jnpr@R1-RE0# run show bgp summary
Groups: 2 Peers: 2 Down peers: 0
Table          Tot Paths  Act Paths Suppressed    History Damp State    Pending
inet.0               200        200          0          0          0          0
inetflow.0             0          0          0          0          0          0
inet6.0                0          0          0          0          0          0
Peer               AS      InPkt     OutPkt    OutQ   Flaps Last Up/Dwn State|
10.3.255.2      65000.65000    12         12       0       0        3:14 Establ
  inet.0: 100/100/100/0
  inetflow.0: 0/0/0/0
192.168.0.1           65222     7         16       0       0        3:18 Establ
  inet.0: 100/100/100/
As is successful negotiation of the flow NLRI during BGP, capabilities exchange is confirmed by displaying the IBGP neighbor to confirm that the inet-flow NLRI is in effect:
{master}[edit]
jnpr@R1-RE0# run show bgp neighbor 10.3.255.2 | match nlri
  NLRI for restart configured on peer: inet-unicast inet-flow
  NLRI advertised by peer: inet-unicast inet-flow
  NLRI for this session: inet-unicast inet-flow
  NLRI that restart is negotiated for: inet-unicast inet-flow
  NLRI of received end-of-rib markers: inet-unicast inet-flow
  NLRI of all end-of-rib markers sent: inet-unicast inet-flow
And lastly, a quick confirmation of routing to both loopback and EBGP prefixes, from the perspective of R2:
{master}[edit]
jnpr@R2-RE0# run show route 10.3.255.1

inet.0: 219 destinations, 219 routes (219 active, 0 holddown, 0 hidden)
+ = Active Route, - = Last Active, * = Both

10.3.255.1/32      *[IS-IS/18] 00:11:21, metric 5
                    > to 10.8.0.0 via ae0.1

{master}[edit]
jnpr@R2-RE0# run show route 130.130.1.0/24

inet.0: 219 destinations, 219 routes (219 active, 0 holddown, 0 hidden)
+ = Active Route, - = Last Active, * = Both

130.130.1.0/24     *[BGP/170] 00:01:22, localpref 100, from 10.3.255.1
                      AS path: 65222 ?
                    > to 10.8.0.0 via ae0.1
The output confirms that IS-IS is supporting the IBGP session by providing a route to the remote router’s loopback address, and that R2 is learning the 130.130/16 prefixes from R1, which in turn learned them via its EBGP peering to P1.
Let the Attack Begin!
With the stage set, things begin with a DDoS log alert at R2:
{master}[edit]
jnpr@R2-RE0# run show log messages | match ddos
Mar 18 17:43:47  R2-RE0 jddosd[75147]: DDOS_PROTOCOL_VIOLATION_SET: Protocol
ICMP:aggregate is violated at fpc 2 for 4 times, started at 2012-03-18 17:43:47
PDT, last seen at 2012-03-18 17:43:47 PDT
Meanwhile, back at R1, no violations are reported, making it clear that R2 is the sole victim of the current DDoS bombardment:
{master}[edit]
jnpr@R1-RE0# run show ddos-protection protocols violations
Number of packet types that are being violated: 0
The syslog entry warns of excessive ICMP traffic at FPC 2. Details on the current violation are obtained with a show ddos protocols command:
jnpr@R2-RE0# run show ddos-protection protocols violations
Number of packet types that are being violated: 1
Protocol    Packet      Bandwidth  Arrival   Peak      Policer bandwidth
group       type        (pps)      rate(pps) rate(pps) violation detected at
icmp        aggregate   20000      13587     13610     2012-03-18 17:43:47 PDT
          Detected on: FPC-2

{master}[edit]
jnpr@R2-RE0# run show ddos-protection protocols icmp
Protocol Group: ICMP

  Packet type: aggregate (Aggregate for all ICMP traffic)
    Aggregate policer configuration:
      Bandwidth:        20000 pps
      Burst:            20000 packets
      Priority:         high
      Recover time:     300 seconds
      Enabled:          Yes
    System-wide information:
      Aggregate bandwidth is being violated!
        No. of FPCs currently receiving excess traffic: 1
        No. of FPCs that have received excess traffic:  1
        Violation first detected at: 2012-03-18 17:43:47 PDT
        Violation last seen at:      2012-03-18 17:58:26 PDT
        Duration of violation: 00:14:39 Number of violations: 4
      Received:  22079830            Arrival rate:     13607 pps
      Dropped:   566100              Max arrival rate: 13610 pps
    Routing Engine information:
      Aggregate policer is never violated
      Received:  10260083            Arrival rate:     6001 pps
      Dropped:   0                   Max arrival rate: 6683 pps
        Dropped by individual policers: 0
    FPC slot 2 information:
      Bandwidth: 30% (6000 pps), Burst: 30% (6000 packets), enabled
      Aggregate policer is currently being violated!
        Violation first detected at: 2012-03-18 17:43:47 PDT
        Violation last seen at:      2012-03-18 17:58:26 PDT
        Duration of violation: 00:14:39 Number of violations: 4
      Received:  22079830            Arrival rate:     13607 pps
      Dropped:   566100              Max arrival rate: 13610 pps
        Dropped by individual policers: 0
        Dropped by aggregate policer: 566100
The output confirms ICMP aggregate-level discards at the FPC level, with a peak load of 13,600 pps, well in excess of the currently permitted 6,000 pps. In addition, and much to your satisfaction, R2 remains responsive showing that the DDoS first line of defense is doing its job. However, aside from knowing there is a lot of ICMP arriving at FPC 2 for this router, there is not much to go on yet as far as tracking the attack back toward its source, flow-spec style or otherwise. You know this ICMP traffic must be destined for R2, either due to unicast or broadcast, because only host-bound traffic is subjected to DDoS policing.
The loopback filter counters and policer statistics are displayed at R2:
{master}[edit]
jnpr@R2-RE0# run show firewall filter lo0.0-i

Filter: lo0.0-i
Counters:
Name                                                Bytes              Packets
accept-bfd-lo0.0-i                                  25948                  499
accept-bgp-lo0.0-i                                   1744                   29
accept-dns-lo0.0-i                                      0                    0
accept-icmp-lo0.0-i                              42252794               918539
accept-ldp-discover-lo0.0-i                             0                    0
accept-ldp-igmp-lo0.0-i                                 0                    0
accept-ldp-unicast-lo0.0-i                              0                    0
accept-ntp-lo0.0-i                                      0                    0
accept-ntp-server-lo0.0-i                               0                    0
accept-rsvp-lo0.0-i                                     0                    0
accept-ssh-lo0.0-i                                      0                    0
accept-telnet-lo0.0-i                                7474                  180
accept-tldp-discover-lo0.0-i                            0                    0
accept-traceroute-icmp-lo0.0-i                          0                    0
accept-traceroute-tcp-lo0.0-i                           0                    0
accept-traceroute-udp-lo0.0-i                           0                    0
accept-vrrp-lo0.0-i                                  3120                   78
accept-web-lo0.0-i                                      0                    0
discard-all-TTL_1-unknown-lo0.0-i                       0                    0
discard-icmp-lo0.0-i                                    0                    0
discard-ip-options-lo0.0-i                             32                    1
discard-netbios-lo0.0-i                                 0                    0
discard-tcp-lo0.0-i                                     0                    0
discard-udp-lo0.0-i                                     0                    0
discard-unknown-lo0.0-i                                 0                    0
no-icmp-fragments-lo0.0-i                               0                    0
Policers:
Name                                                Bytes              Packets
management-1m-accept-dns-lo0.0-i                        0                    0
management-1m-accept-ntp-lo0.0-i                        0                    0
management-1m-accept-ntp-server-lo0.0-i                 0                    0
management-1m-accept-telnet-lo0.0-i                     0                    0
management-1m-accept-traceroute-icmp-lo0.0-i            0                    0
management-1m-accept-traceroute-tcp-lo0.0-i             0                    0
management-1m-accept-traceroute-udp-lo0.0-i             0                    0
management-5m-accept-icmp-lo0.0-i             21870200808            475439148
management-5m-accept-ssh-lo0.0-i                        0                    0
management-5m-accept-web-lo0.0-i                        0                    0
The counters for the management-5m-accept-icmp-lo0.0-I prefix-specific counter and policers make it clear that a large amount of ICMP traffic is hitting the loopback filter and being policed by the related 5 M policer. Given that the loopback policer is executed before the DDoS processing, right as host-bound traffic arrives at the Trio PFE, it’s clear that the 5 Mbps of ICMP that is permitted by the policer amounts to more than the 6,000 pps; otherwise, there would be no current DDoS alert or DDoS discard actions in the FPC.
Knowing that a policer evoked through a loopback filter is executed before any DDoS processing should help in dimensioning your DDoS and loopback policers so they work well together. Given that a filter-evoked policer measures bandwidth in bits per second while the DDoS policers function on a packet-per-second basis should make it clear that trying to match them is difficult at best and really isn’t necessary anyway.
Because a loopback policer represents a system-level aggregate, there is some sense to setting the policer higher than that in any individual FPC. If the full expected aggregate arrives on a single FPC, then the lowered DDoS settings in the FPC will kick in to ensure that no one FPC can consume the system’s aggregate bandwidth, thereby ensuring plenty of capacity of other FPCs that have normal traffic loads. The downside to such a setting is that you can now expect FPC drops even when only one FPC is active and below the aggregate system load.
Determine attack details and define flow route
Obtaining the detail needed to describe the attack flow is where sampling or filter-based logging often come into play. In fact, the current RE protection filter has a provision for logging:
{master}[edit]
jnpr@R2-RE0# show firewall family inet filter accept-icmp
apply-flags omit;
term no-icmp-fragments {
    from {
        is-fragment;
        protocol icmp;
    }
    then {
        count no-icmp-fragments;
        log;
        discard;
    }
}
term accept-icmp {
    from {
        protocol icmp;
        ttl-except 1;
        icmp-type [ echo-reply echo-request time-exceeded unreachable source-
        quench router-advertisement parameter-problem ];
    }
    then {
        policer management-5m;
        count accept-icmp;
        log;
        accept;
    }
}
The presence of the log and syslog action modifiers in the accept-icmp filter means you simply need to display the firewall cache or syslog to obtain the details needed to characterize the attack flow:
jnpr@R2-RE0# run show firewall log
Log :
Time      Filter    Action Interface     Protocol    Src Addr       Dest Addr
18:47:47  pfe       A      ae0.1         ICMP        130.130.33.1   10.3.255.2
18:47:47  pfe       A      ae0.1         ICMP        130.130.60.1   10.3.255.2
18:47:47  pfe       A      ae0.1         ICMP        130.130.48.1   10.3.255.2
18:47:47  pfe       A      ae0.1         ICMP        130.130.31.1   10.3.255.2
18:47:47  pfe       A      ae0.1         ICMP        130.130.57.1   10.3.255.2
18:47:47  pfe       A      ae0.1         ICMP        130.130.51.1   10.3.255.2
18:47:47  pfe       A      ae0.1         ICMP        130.130.50.1   10.3.255.2
18:47:47  pfe       A      ae0.1         ICMP        130.130.3.1    10.3.255.2
18:47:47  pfe       A      ae0.1         ICMP        130.130.88.1   10.3.255.2
18:47:47  pfe       A      ae0.1         ICMP        130.130.94.1   10.3.255.2
18:47:47  pfe       A      ae0.1         ICMP        130.130.22.1   10.3.255.2
18:47:47  pfe       A      ae0.1         ICMP        130.130.13.1   10.3.255.2
18:47:47  pfe       A      ae0.1         ICMP        130.130.74.1   10.3.255.2
18:47:47  pfe       A      ae0.1         ICMP        130.130.77.1   10.3.255.2
18:47:47  pfe       A      ae0.1         ICMP        130.130.46.1   10.3.255.2
18:47:47  pfe       A      ae0.1         ICMP        130.130.94.1   10.3.255.2
18:47:47  pfe       A      ae0.1         ICMP        130.130.38.1   10.3.255.2
18:47:47  pfe       A      ae0.1         ICMP        130.130.36.1   10.3.255.2
18:47:47  pfe       A      ae0.1         ICMP        130.130.47.1   10.3.255.2
. . .
The contents of the firewall log make it clear the attack is ICMP based (as already known), but in addition you can now confirm the destination address matches R2’s loopback, and that the source appears to be from a range of 130.130.x/24 subnets from within P1’s 130.130/16 block. Armed with this information, you can contact the administrator of the P1 network to ask them to address the issue, but that can wait until you have this traffic filtered at ingress to your network, rather than after it has had the chance to consume resources in your network and at R2, specifically.
A flow route is defined on R2:
{master}[edit]
jnpr@R2-RE0# show routing-options flow
route block_icmp_p1 {
    match {
        destination 10.3.255.2/32;
        source 130.130.0.0/16;
        protocol icmp;
    }
    then discard;
}
The flow matches all ICMP traffic sent to R2’s loopback address from any source in the 130.130/16 space with a discard action. Once locally defined, the flow-spec is placed into effect (there is no validation for a local flow-spec, much like there is no need to validate a locally defined firewall filter), as confirmed by the current DDoS statistics, which now report a 0 pps arrival rate:
{master}[edit]
jnpr@R2-RE0# run show ddos-protection protocols icmp
Protocol Group: ICMP

  Packet type: aggregate (Aggregate for all ICMP traffic)
    Aggregate policer configuration:
      Bandwidth:        20000 pps
      Burst:            20000 packets
      Priority:         high
      Recover time:     300 seconds
      Enabled:          Yes
    System-wide information:
      Aggregate bandwidth is no longer being violated
        No. of FPCs that have received excess traffic: 1
        Last violation started at: 2012-03-18 18:47:28 PDT
        Last violation ended at:   2012-03-18 18:52:59 PDT
        Duration of last violation: 00:05:31 Number of violations: 5
      Received:  58236794            Arrival rate:     0 pps
      Dropped:   2300036             Max arrival rate: 13620 pps
    Routing Engine information:
      Aggregate policer is never violated
      Received:  26237723            Arrival rate:     0 pps
      Dropped:   0                   Max arrival rate: 6683 pps
        Dropped by individual policers: 0
    FPC slot 2 information:
      Bandwidth: 30% (6000 pps), Burst: 30% (6000 packets), enabled
      Aggregate policer is no longer being violated
        Last violation started at: 2012-03-18 18:47:28 PDT
        Last violation ended at:   2012-03-18 18:52:59 PDT
        Duration of last violation: 00:05:31 Number of violations: 5
      Received:  58236794            Arrival rate:     0 pps
      Dropped:   2300036             Max arrival rate: 13620 pps
        Dropped by individual policers: 0
        Dropped by aggregate policer: 2300036
The presence of a flow-spec filter is confirmed with a show firewall command:
{master}[edit]
jnpr@R2-RE0# run show firewall | find flow

Filter: __flowspec_default_inet__
Counters:
Name                                                Bytes              Packets
10.3.255.2,130.130/16,proto=1                127072020948           2762435238
The presence of the flow-spec filter is good, but the nonzero counters confirm that it’s still matching a boatload of traffic to 10.3.255.2, from 130.130/16 sources, for protocol 1 (ICMP), as per its definition. Odd, as in theory R1 should now also be filtering this traffic, which clearly is not the case; more on that later.
It’s also possible to display the inetflow.0 table directly to see both local and remote entries; the table on R2 currently has only its one locally defined flow-spec:
{master}[edit]
jnpr@R2-RE0# run show route table inetflow.0 detail

inetflow.0: 1 destinations, 1 routes (1 active, 0 holddown, 0 hidden)
10.3.255.2,130.130/16,proto=1/term:1 (1 entry, 1 announced)
        *Flow   Preference: 5
                Next hop type: Fictitious
                Address: 0x8df4664
                Next-hop reference count: 1
                State: <Active>
                Local AS: 4259905000
                Age: 8:34
                Task: RT Flow
                Announcement bits (2): 0-Flow 1-BGP_RT_Background
                AS path: I
                Communities: traffic-rate:0:0
Don’t be alarmed about the fictitious next-hop bit. It’s an artifact from the use of BGP, which has a propensity for next-hops, versus a flow-spec, which has no such need. Note also how the discard action is conveyed via a community that encodes an action of rate limiting the matching traffic to 0 bps.
With R2 looking good, let’s move on to determine why R1 is apparently not yet filtering this flow. Things begin with a confirmation that the flow route is advertised to R1:
{master}[edit]
jnpr@R2-RE0# run show route advertising-protocol bgp 10.3.255.1 table inetflow.0

inetflow.0: 1 destinations, 1 routes (1 active, 0 holddown, 0 hidden)
  Prefix                  Nexthop              MED     Lclpref    AS path
  10.3.255.2,130.130/16,proto=1/term:1
*                         Self                         100        I
As expected, the output confirms that R2 is sending the flow-spec to R1, so you expect to find a matching entry in its inetflow.0 table, along with a dynamically created filter that should be discarding the attack traffic at ingress from P1 as it arrives on the xe-2/1/1 interface. But, thinking back, it was noted that R2’s local flow route is showing a high packet count and discard rate, which clearly indicates that R1 is still letting this traffic through.
Your curiosity piqued, you move to R1 and find the flow route is hidden:
{master}[edit]
jnpr@R1-RE0# run show route table inetflow.0 hidden detail

inetflow.0: 1 destinations, 1 routes (0 active, 0 holddown, 1 hidden)
10.3.255.2,130.130/16,proto=1/term:N/A (1 entry, 0 announced)
         BGP                 /-101
                Next hop type: Fictitious
                Address: 0x8df4664
                Next-hop reference count: 1
                State: <Hidden Int Ext>
                Local AS: 65000.65000 Peer AS: 65000.65000
                Age: 16:19
                Task: BGP_65000.65000.10.3.255.2+179
                AS path: I
                Communities: traffic-rate:0:0
                Accepted
                Validation state: Reject, Originator: 10.3.255.2
                Via: 10.3.255.2/32, Active
                Localpref: 100
                Router ID: 10.3.255.2
Given the flow route is hidden, no filter has been created at R1:
{master}[edit]
jnpr@R1-RE0# run show firewall | find flow

Pattern not found
{master}[edit]
And as a result, the attack data is confirmed to be leaving R1’s ae0 interface on its way to R2:
Interface: ae0, Enabled, Link is Up
Encapsulation: Ethernet, Speed: 20000mbps
Traffic statistics:                                           Current delta
  Input bytes:                 158387545 (6624 bps)                     [0]
  Output bytes:            4967292549831 (2519104392 bps)               [0]
  Input packets:                 2335568 (12 pps)                       [0]
  Output packets:            52813462522 (6845389 pps)                  [0]
Error statistics:
  Input errors:                        0                                [0]
  Input drops:                         0                                [0]
  Input framing errors:                0                                [0]
  Carrier transitions:                 0                                [0]
  Output errors:                       0                                [0]
  Output drops:                        0                                [0]
Thinking a bit about the hidden flow-spec and its rejected state, the answer arrives: this is a validation failure. Recall that, by default, only the current best source of a route is allowed to generate a flow-spec that could serve to filter the related traffic. Here, R2 is not the BGP source of the 130.130/16 route that the related flow-spec seeks to filter. In effect, this is a third-party flow-spec, and as such, it does not pass the default validation procedure. You can work around this issue by using the no-validate option along with a policy at R1 that tells it to accept the route. First, the policy:
{master}[edit]
jnpr@R1-RE0# show policy-options policy-statement accept_icmp_flow_route
term 1 {
    from {
        route-filter 10.3.255.2/32 exact;
    }
    then accept;
}
The policy is applied under the flow family using the no-validate keyword:
{master}[edit]
jnpr@R1-RE0# show protocols bgp group int
type internal;
local-address 10.3.255.1;
family inet {
    unicast;
    flow {
        no-validate accept_icmp_flow_route;
    }
}
bfd-liveness-detection {
    minimum-interval 2500;
    multiplier 3;
}
neighbor 10.3.255.2
After the change is committed, the flow route is confirmed at R1:
{master}[edit]
jnpr@R1-RE0# run show firewall | find flow

Filter: __flowspec_default_inet__
Counters:
Name                                                Bytes              Packets
10.3.255.2,130.130/16,proto=1                  9066309970            197093695
The 10.3.255.2,130.130/16,proto=1 flow-spec filter has been activated at R1, a good indication the flow-spec route is no longer hidden due to validation failure. The net result that you have worked so hard for is that now, the attack data is no longer being transported over your network just to be discarded at R2.
{master}[edit]
jnpr@R1-RE0# run monitor interface ae0

Next='n', Quit='q' or ESC, Freeze='f', Thaw='t', Clear='c', Interface='i'
R1-RE0                            Seconds: 0                   Time: 19:18:22
                                                        Delay: 16/16/16
Interface: ae0, Enabled, Link is Up
Encapsulation: Ethernet, Speed: 20000mbps
Traffic statistics:                                           Current delta
  Input bytes:                 158643821 (6480 bps)                     [0]
  Output bytes:            5052133735948 (5496 bps)                     [0]
  Input packets:                 2339427 (12 pps)                       [0]
  Output packets:            54657835299 (10 pps)                       [0]
Error statistics:
  Input errors:                        0                                [0]
  Input drops:                         0                                [0]
  Input framing errors:                0                                [0]
  Carrier transitions:                 0                                [0]
  Output errors:                       0                                [0]
  Output drops:                        0                                [0]
This completes the DDoS mitigation case study.
Summary
The Junos OS combined with Trio-based PFEs offers a rich set of stateless firewall filtering, a rich set of policing options, and some really cool built-in DDoS capabilities. All are performed in hardware so you can enable them in a scaled production environment without appreciable impact to forwarding rates.
Even if you deploy your MX in the core, where edge-related traffic conditions and contract enforcement is typically not required, you still need stateless filters, policers, and/or DDoS protection to protect your router’s control plane from unsupported services and to guard against excessive traffic, whether good or bad, to ensure the router remains secure and continues to operate as intended even during periods of abnormal volume of control plane traffic, be it intentional or attack based.
This chapter provided current best practice templates from strong RE protection filters for both the IPv4 and IPv6 control planes. All readers should compare their current RE protection filters to the examples provided to decide if any modifications are needed to maintain current best practice in this complex, but all too important, subject.
The DDoS feature, supported on Trio line cards only, works symbiotically with RE protection filters, or can function standalone, and acts as a robust primary, secondary, and tertiary line of defense to protect the control plane from resource exhaustion that stems from excessive traffic that could otherwise impact service, or worse, render the device inoperable and effectively unreachable during the very times you need access the most!
Combining DDoS policers with suspicious flow detection offers increased granularity that allows for policing of culprit flows at the individual subscriber, IFL, or IFD levels to help ensure fair access at a given DDoS hierarchy level.
Chapter Review Questions
- 1. Which is true regarding the DDoS prevention feature?
The feature is off by default
The feature is on by default with aggressive policers
The feature is on by default but requires policer configuration before any alerts or policing can occur
The feature is on by default with high policer rates that in most cases exceed system control plane capacity to ensure no disruption to existing functionality
- 2. Which is true about DDoS policers and RE protection policers evoked though a filter?
The lo0 policer is disabled when DDoS is in effect
The DDoS policers run first with the lo0 policer executed last
The lo0 policer is executed before and after the DDoS policers, once at ingress and again in the RE
Combining lo0 and DDoS policers is not permitted and a commit error is retuned
- 3. A strong RE protection filter should end with which of the following?
An accept-all to ensure no disruption
A reject-all, to send error messages to sources of traffic that is not permitted
A discard-all to silently discard traffic that is not permitted
A log action to help debug filtering of valid/permitted services
Both C and D
- 4. A filter is applied to the main instance lo0.0 and a VRF is defined without its own lo0.n IFL. Which is true?
Traffic from the instance to the local control plane is filtered by the lo0.0 filter
Traffic from the instance to remote VRF destinations is filtered by the lo0.0 filter
Traffic from the instance to the local control plane is not filtered
None of the above. VRFs require a lo0.n for their routing protocols to operate
- 5. What Junos feature facilitates simplified filter management when using address-based match criteria to permit only explicitly defined BGP peers?
Dynamic filter lists
Prefix lists and the
apply-pathstatementThe ability to specify a 0/0 as a match-all in an address-based match condition
All of the above
An srTCM policer applied at the unit level for all Layer 2 families using the
layer2-policerstatement
- 6. What is the typical use case for an RE filter applied in the output direction?
To ensure your router is not generating attack traffic
To track the traffic sent from the router for billing purposes
A trick question; output filters are not supported
To alter CoS/ToS marking and queuing for locally generated control plane traffic
- 7. Which of the below is best suited to policing individual subscriber flows?
Suspicious Control Flow Detection
DDoS hierarchical policers
Default ARP policer
Logical interface (IFL) policer
Chapter Review Answers
- 1. Answer: D.
- Because DDoS is on by default, the policers are set to the same high values as when the feature is disabled, effectively meaning the host-bound traffic from a single PFE is limited by the processing path capabilities and not DDoS protection. You must reduce the defaults to suit the needs of your network to gain additional DDoS protection outside of alerting and policing at aggregation points for attacks on multiple PFEs.
- 2. Answer: C.
- When an lo0 policer is present, it is executed first, as traffic arrives at the line card, before any DDoS (even Trio PFE-level) are executed. In addition, a copy of the RE policer is also stored in the kernel where its acts on the aggregate load going to the RE, after the DDoS policer stage.
- 3. Answer: E.
- A strong security filter always uses a discard-all as a final term. Using rejects can lead to resource usage in the form of error messages, a bad idea when under an attack. Adding the log action to the final term is a good idea, as it allows you to quickly confirm what traffic is hitting the final discard term. Unless you are being attacked, very little traffic should be hitting the final term, so the log action does not represent much burden. The firewall cache is kept in the kernel, and only displayed when the operator requests the information, unlike a syslog filter action, which involves PFE-to-RE traffic on an ongoing basis for traffic matching the final discard term.
- 4. Answer: A.
- When a routing instance has a filter applied to an lo0 unit in that instance, that filter is used; otherwise, control plane traffic from the instance to the RE is filtered by the main instance lo0.0 filter.
- 5. Answer: B.
- Use
prefix-listsand theapply-pathfeature to build a dynamic list of prefixes that are defined somewhere else on the router (e.g., those assigned to interfaces or used in BGP peer definitions), and then use the dynamic list as a match condition in a filter to simplify filter management in the face of new interface or peer definitions. - 6. Answer: D.
- Output filters are most often used to alter the default CoS/ToS marking for locally generated traffic.
- 7. Answer: A.
- The SCFD process can police flows at the subscriber, IFL, or IFD levels based on predefined thresholds. The other options are too granular to work on an individual user/subscriber basis.
Get Juniper MX Series, 2nd Edition now with the O’Reilly learning platform.
O’Reilly members experience books, live events, courses curated by job role, and more from O’Reilly and nearly 200 top publishers.

