This case study is designed to show the DDoS prevention feature in
action. It begins with the modified configuration for the ip-options group discussed in the previous
section. So far, no DDoS alerts or trace activity have been detected on
R1, as evidenced by the lack of alerts in the system log files:
{master}

{master}
jnpr@R1-RE0> show log messages | match ddos

{master}
jnpr@R1-RE0> show log ddos_trace

{master}
jnpr@R1-RE0>
No real surprise, given the system’s lab setting and the lack of hostile intent in those who, having had the pleasure of using it, have developed somewhat affectionate feelings for the little chassis. At any extent, in the interest of moving things along, the author has agreed to use a router tester to target R1 with the proverbial boatload of IP optioned packets. After all, DDoS protection is in place so no routers should be harmed in the experiment. In this case, all the packets are coded with the infamous router alert—recall this option forces RE-level processing and thereby serves as a potential attack vector among the more shady characters that share our civilization.
Figure 4-3 shows the topology details for the DDoS protection lab.
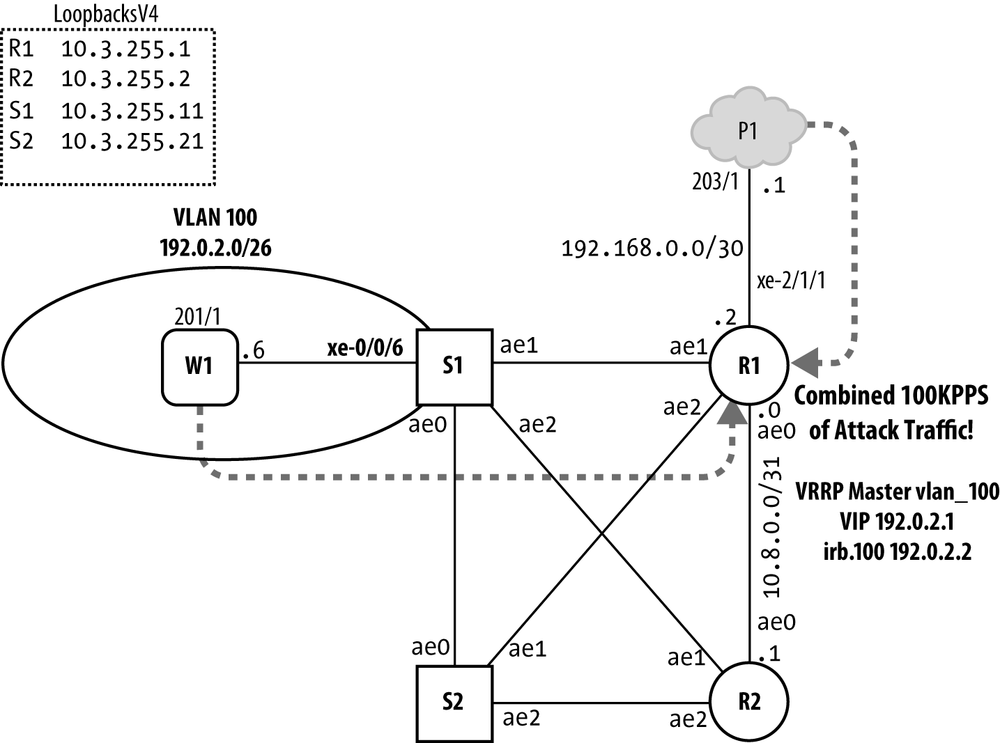
The plan is to generate two identical streams
of these black-hat- wearing packets, one via the xe-0/0/6 Layer 2 access
interface at S1 and the other over the xe-2/1/1 Layer 3 interface
connecting R1 to P1. Both packet streams are sent from IP address
192.0.2.20 and destined to the 192.0.2.3 address assigned to r2’s VLAN 100
IRB interface. Recall that the presence of the router-alert option forces R1 to examine this
transit traffic even though it’s not addressed to one of its local IP
addresses. The Ethernet frame’s destination MAC address is set to all 1’s
broadcast, a setting that ensures copies of the same stream will be
accepted for processing/routing on R1’s Layer 3 interface while also
flooded in the VLAN 100 Layer 2 domain by S1. The packets are 128 bytes
long at Layer 2 and are generated at 50,000 packets per second, for a
combined load of 100K PPS.
That is a fair amount of traffic for an RE to process, each and every second. This could be dangerous, if not for DDoS protection!
The stage is set, and the DDoS daemon is standing by, ready to take the best of whatever shot you can throw, so traffic generation is initiated.
Oh, the humanity . . . But wait, the router is still responsive,
there is no meltdown. In fact, the only real indication that anything is
amiss is the syslog entry from jddosd
reporting the violation:
jnpr@R1-RE0> show log messages | match ddos
Dec 19 18:16:56  R1-RE0 jddosd[1541]: DDOS_PROTOCOL_VIOLATION_SET: Protocol
  IP-Options:router-alert is violated at fpc 2 for 1 times, started at
  2011-12-19 18:16:56 PST, last seen at 2011-12-19 18:16:56 PST
The syslog information flags you as to the nature of the attack traffic, as well as the affected FPC, in this case FPC 2. The same information is also found to be written to the DDoS trace file, which can be handy if someone has disabled DDoS logging globally, as the global disable logging statement only controls logging to the main syslog messages file, not to a DDoS-specific trace file:
{master}[edit]
jnpr@R1-RE0# run show log ddos_trace

Dec 19 18:16:56 Protocol IP-Options:router-alert is violated at fpc 2 for 1 times,
started at 2011-12-19 18:16:56 PST, last seen at 2011-12-19 18:16:56 PSTOnce you are alerted that abnormal levels of control plane traffic has been detected, you can quickly narrow down the nature and scope of the anomaly using the following process.
First, confirm violation state with a show ddos-protection statistics
command:
{master}
jnpr@R1-RE0> show ddos-protection statistics
DDOS protection global statistics:
  Currently violated packet types:    1
  Packet types have seen violations:  1
  Total violation counts:             1
To display the scope of protocols currently involved, add the
violations keyword:
{master}
jnpr@R1-RE0> show ddos-protection protocols violations
Number of packet types that are being violated: 1
Protocol    Packet      Bandwidth  Arrival   Peak      Policer bandwidth
group       type        (pps)      rate(pps) rate(pps) violation detected at
ip-opt      rt-alert    5000       100004    100054    2011-12-19 18:16:56 PST
          Detected on: FPC-2
With no other protocols in a violation state, and knowing it’s not just IP options but specifically router alerts that make up the attack, move on to display the details for that traffic type:
{master}
jnpr@R1-RE0> show ddos-protection protocols ip-options router-alert
Protocol Group: IP-Options

  Packet type: router-alert (Router alert options traffic)
    Individual policer configuration:
      Bandwidth:        5000 pps
      Burst:            20000 packets
      Priority:         high
      Recover time:     150 seconds
      Enabled:          Yes
      Bypass aggregate: No
    System-wide information:
      Bandwidth is being violated!
        No. of FPCs currently receiving excess traffic: 1
        No. of FPCs that have received excess traffic:  1
        Violation first detected at: 2011-12-19 18:16:56 PST
        Violation last seen at:      2011-12-19 18:19:33 PST
        Duration of violation: 00:02:37 Number of violations: 1
      Received:  15927672            Arrival rate:     100024 pps
      Dropped:   10402161            Max arrival rate: 100054 pps
    Routing Engine information:
      Policer is never violated
      Received:  374395              Arrival rate:     2331 pps
      Dropped:   0                   Max arrival rate: 2388 pps
        Dropped by aggregate policer: 0
    FPC slot 1 information:
      Bandwidth: 100% (5000 pps), Burst: 100% (20000 packets), enabled
      Policer is never violated
      Received:  0                   Arrival rate:     0 pps
      Dropped:   0                   Max arrival rate: 0 pps
        Dropped by aggregate policer: 0
    FPC slot 2 information:
      Bandwidth: 100% (5000 pps), Burst: 100% (20000 packets), enabled
      Policer is currently being violated!
        Violation first detected at: 2011-12-19 18:16:56 PST
        Violation last seen at:      2011-12-19 18:19:33 PST
        Duration of violation: 00:02:37 Number of violations: 1
      Received:  15927672            Arrival rate:     100024 pps
      Dropped:   10402161            Max arrival rate: 100054 pps
        Dropped by this policer: 10402161
        Dropped by aggregate policer: 0
The very fact that this output is obtained proves that R1 has remained responsive throughout the event, and thereby the effectiveness of the new Trio DDoS protection. Note how the stats for policing at the RE level show a peak load of only 2,388 PPS, while the FPC 2 statistics confirm an arrival rate of 100,000 PPS. And large numbers of drops are confirmed, which accounts for the difference in Trio/FPC policing load versus the volume of traffic that is actually making it to the RE.
The display also confirms that all of the bad traffic ingresses on FPC2. Just knowing that can help you apply filters or other methods to begin tracking back to the point at which the bad traffic ingresses your network, so you can either disable the peering interface or apply a filter to block the traffic before it endangers your network.
It’s often helpful to display protocol group-level information, which also includes any individual packet policers, even when you know a specific violation is caught with an individual packet policer, such as the case with the router alert example being discussed. The group-level displays combined information from all five policing points, albeit in what can be a rather long display, which helps you identify Trio-level PFE policing actions from those in the FPC or RE. To best illustrate how the DDoS hierarchical policers work, the statistics and state from the last experiment are cleared:
{master}
jnpr@R1-RE0> clear ddos-protection protocols statistics
jnpr@R1-RE0> clear ddos-protection protocols state
And the traffic generator is altered to send one million router alert packets, at a 100K PPS rate, over a single interface. The round numbers should help make later analysis that much easier. After the traffic is sent, the protocol group-level DDoS policer information is displayed:
{master}
jnpr@R1-RE0> show ddos-protection protocols ip-options
Protocol Group: IP-Options

  Packet type: aggregate (Aggregate for all options traffic)
    Aggregate policer configuration:
      Bandwidth:        10000 pps
      Burst:            500 packets
      Priority:         high
      Recover time:     300 seconds
      Enabled:          Yes
    System-wide information:
      Aggregate bandwidth is never violated
      Received:  71751               Arrival rate:     0 pps
      Dropped:   0                   Max arrival rate: 6894 pps
    Routing Engine information:
      Aggregate policer is never violated
      Received:  40248               Arrival rate:     0 pps
      Dropped:   0                   Max arrival rate: 4262 pps
        Dropped by individual policers: 0
    FPC slot 1 information:
      Bandwidth: 100% (10000 pps), Burst: 100% (500 packets), enabled
      Aggregate policer is never violated
      Received:  0                   Arrival rate:     0 pps
      Dropped:   0                   Max arrival rate: 0 pps
        Dropped by individual policers: 0
    FPC slot 2 information:
      Bandwidth: 100% (10000 pps), Burst: 100% (500 packets), enabled
      Aggregate policer is never violated
      Received:  71751               Arrival rate:     0 pps
      Dropped:   31743               Max arrival rate: 6894 pps
        Dropped by individual policers: 31743

  Packet type: unclassified (Unclassified options traffic)
    Individual policer configuration:
      Bandwidth:        10000 pps
      Burst:            10000 packets
      Priority:         medium
      Recover time:     300 seconds
      Enabled:          Yes
      Bypass aggregate: No
    System-wide information:
      Bandwidth is never violated
      Received:  0                   Arrival rate:     0 pps
      Dropped:   0                   Max arrival rate: 0 pps
    Routing Engine information:
      Policer is never violated
      Received:  0                   Arrival rate:     0 pps
      Dropped:   0                   Max arrival rate: 0 pps
        Dropped by aggregate policer: 0
    FPC slot 1 information:
      Bandwidth: 100% (10000 pps), Burst: 100% (10000 packets), enabled
      Policer is never violated
      Received:  0                   Arrival rate:     0 pps
      Dropped:   0                   Max arrival rate: 0 pps
        Dropped by aggregate policer: 0
    FPC slot 2 information:
      Bandwidth: 100% (10000 pps), Burst: 100% (10000 packets), enabled
      Policer is never violated
      Received:  0                   Arrival rate:     0 pps
      Dropped:   0                   Max arrival rate: 0 pps
        Dropped by aggregate policer: 0

  Packet type: router-alert (Router alert options traffic)
    Individual policer configuration:
      Bandwidth:        5000 pps
      Burst:            20000 packets
      Priority:         high
      Recover time:     150 seconds
      Enabled:          Yes
      Bypass aggregate: No
    System-wide information:
      Bandwidth is being violated!
        No. of FPCs currently receiving excess traffic: 1
        No. of FPCs that have received excess traffic:  1
        Violation first detected at: 2011-12-19 19:00:43 PST
        Violation last seen at:      2011-12-19 19:00:53 PST
        Duration of violation: 00:00:10 Number of violations: 2
      Received:  1000000             Arrival rate:     0 pps
      Dropped:   819878              Max arrival rate: 100039 pps
    Routing Engine information:
      Policer is never violated
      Received:  40248               Arrival rate:     0 pps
      Dropped:   0                   Max arrival rate: 4262 pps
        Dropped by aggregate policer: 0
    FPC slot 1 information:
      Bandwidth: 100% (5000 pps), Burst: 100% (20000 packets), enabled
      Policer is never violated
      Received:  0                   Arrival rate:     0 pps
      Dropped:   0                   Max arrival rate: 0 pps
        Dropped by aggregate policer: 0
    FPC slot 2 information:
      Bandwidth: 100% (5000 pps), Burst: 100% (20000 packets), enabled
      Policer is currently being violated!
        Violation first detected at: 2011-12-19 19:00:43 PST
        Violation last seen at:      2011-12-19 19:00:53 PST
        Duration of violation: 00:00:10 Number of violations: 2
      Received:  1000000             Arrival rate:     0 pps
      Dropped:   819878              Max arrival rate: 100039 pps
        Dropped by this policer: 819878
        Dropped by aggregate policer: 0
There is a lot of information here; refer back to Figure 4-2 for a reminder on the five levels of DDoS policing that are possible, and let’s take it one step at a time.
The first stage of DDoS policing occurs at the Trio FPC level.
The ingress Trio statistics are at the bottom of the display, under
the Packet type: router-alert (Router alert
options traffic) heading. The maximum arrival rate of
1,000,039 PPS corresponds nicely with the traffic’s burst length and
rate parameters, as does the received count of 1,000,000 packets. The
display confirms that this policer is currently violated, and,
importantly, shows that 819,878 packets have been dropped.
Recall that the goal of Junos DDoS protection is to first recognize when there is excessive control plane traffic and then to cut it off as close to the source and as far away from the RE as possible. The numbers confirm that over 80% of the excess traffic was discarded, and this in the first of as many as five policing stages. Clearly, DDoS has acted to preserve control plane resources farther up the line. With the drops shown at this stage, there should be some 180,122 options packets still making their way up north to the land of the RE.
The next step is the FPC policer, which for this group is a
two-stage policer with individual- and aggregate-level policing. Its
details are in the FPC slot 2
information under the aggregate
(Aggregate for all options traffic) heading. Here is where
you have to do some detective work. The display confirms that the
FPC-level aggregate policer was never violated, but at the same time
it shows 31,743 drops, which therefore had to come from its individual
packet policer stage. The display also shows the FPC policing stage
received only 71,751 packets, which is well short of the 180,122 that
made it through the Trio PFE-level policer.
When asked about the discrepancy between DDoS stages, a software
engineer confirmed the presence of “legacy policing functions that may
also drop excess traffic on the host path.” For example, the built-in
ICMP rate limiting function that is viewed with a show system statistics icmp command. The
defaults can be altered via the set system
internet-options configuration statement:
[edit]
jnpr@R4# set system internet-options icmpv?
Possible completions:
> icmpv4-rate-limit    Rate-limiting parameters for ICMPv4 messages
> icmpv6-rate-limit    Rate-limiting parameters for ICMPv6 messages
Here, the V4 options are shown:
[edit]
jnpr@R4# set system internet-options icmpv4-rate-limit ?
Possible completions:
  bucket-size          ICMP rate-limiting maximum bucket size (seconds)
  packet-rate          ICMP rate-limiting packets earned per second
[edit]
jnpr@R4# set system internet-options icmpv4-rate-limit
The moral of the story is you should not expect 100% correlation of the counters shown at the various policing stages, as this data only reflects actions associated with DDoS processing and not those of other host protection mechanisms that may continue to coexist. Recall the goal of the feature is to protect the RE while providing the operator with the information needed to ascertain the scope and nature of an attack, not to provide statistics suitable for usage-based billing.
The fact that the FPC’s aggregate policer was never violated is a testament to the effectiveness of the actions at the first stage. With the FPC showing receipt of 71,757 packets, and factoring the 31,743 discards, there should be about 40,014 packets left to make their way through the final policing stage in the RE itself.
The RE’s policer stats are shown in a few places. Looking at the one under the group aggregate, it’s possible to see it has received a total of 40,248 packets. The display also confirms no discards in the RE policer at either the individual or aggregate levels. The number is slightly higher than the 40,014 that were assumed to have left the FPC, perhaps due to some other legacy system function, but the numbers still mesh relatively well with the known nature of this attack. In the end, the fact that 1M of these puppies were sent while the RE only had to deal with 40K of them, all due to a hardware-based feature that has no forwarding performance impact, should really drive home the benefits of this Trio-only feature.
Get Juniper MX Series now with the O’Reilly learning platform.
O’Reilly members experience books, live events, courses curated by job role, and more from O’Reilly and nearly 200 top publishers.

