Unicode plots
Unicode plots are really useful when we want to plot on the REPL. They are extremely lightweight.
Installation
There are no dependencies, so they can be installed easily:
Pkg.add("UnicodePlots")
using UnicodePlots
Examples
Let's walk through the basic plots that can be made easily using UnicodePlots.
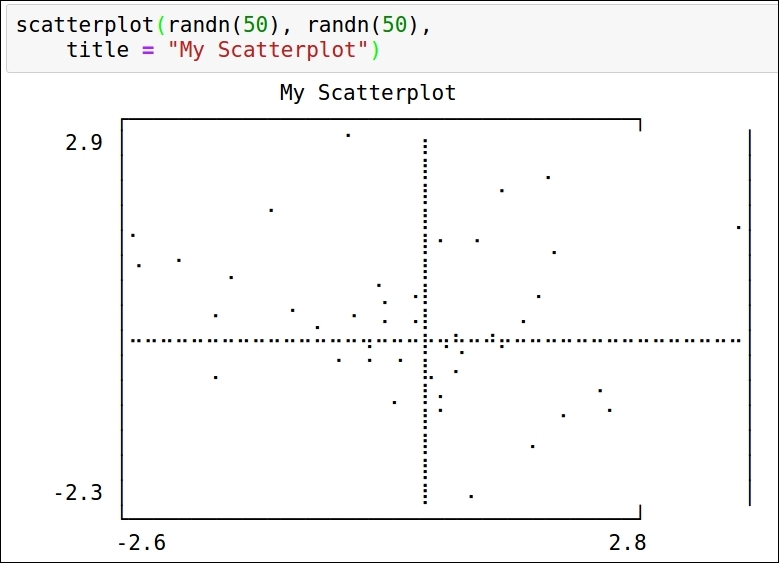
Generating Unicode scatterplots
Scatterplots are used to determine the correlation between two variables, that is, how one is affected by the other:
Generating Unicode line plots
A line plot displays the dataset in a series of data points:
Get Julia for Data Science now with the O’Reilly learning platform.
O’Reilly members experience books, live events, courses curated by job role, and more from O’Reilly and nearly 200 top publishers.

