A Answers to Selected Exercises
Chapter 4, “Formula Editor”
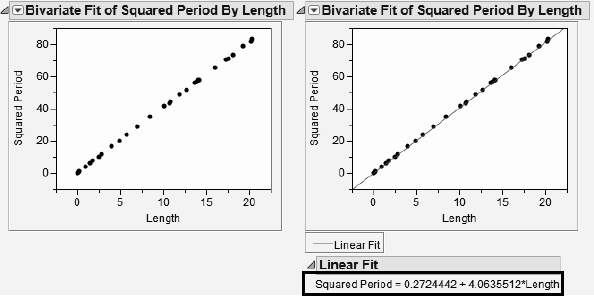
1a. (left) and 1b. (right)

1c. (left) - the Period2 linearized the data, and 1d. (right), the line of best fit
1e.
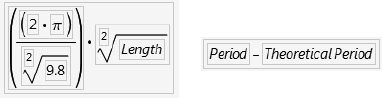
1f. Enter the formula below (left) into a new column. Then make another new column to find the difference between observed and theoretical period values (right).
Use the Distribution platform to get the following ...
Get JMP Start Statistics, 6th Edition now with the O’Reilly learning platform.
O’Reilly members experience books, live events, courses curated by job role, and more from O’Reilly and nearly 200 top publishers.

