Adding Scripts to Graphs
If you right-click on a graphics frame, you can enter or paste JSL commands. The script usually contains drawing commands that run in the context of the graphics frame. The context of the graphics frame includes the data range of the axes and the order that the data and scripts are drawn in.
The following example shows how to add a script to a graph:
1. Select Help > Sample Data Library and open Big Class.jmp.
2. Select Analyze > Fit Y by X.
3. Choose Weight for Y and Height for X, and then click OK.
4. Right-click inside the graph and select Customize.
Figure 12.1 Customizing the Graph Options
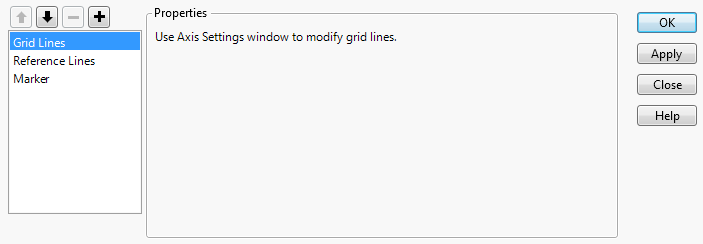
5. Click the Add button ...
Get JMP 13 Scripting Guide now with the O’Reilly learning platform.
O’Reilly members experience books, live events, courses curated by job role, and more from O’Reilly and nearly 200 top publishers.

