Chapter 8
Variability Gauge Charts
Evaluate a Continuous Measurement Process Using Gauge R&R
Variability gauge charts analyze continuous measurements and can reveal how your measurement system is performing. You can also perform a gauge study to see measures of variation in your data.
Tip: This chapter covers only variability charts. For details about attribute charts, see the âAttribute Gauge Chartsâ chapter.
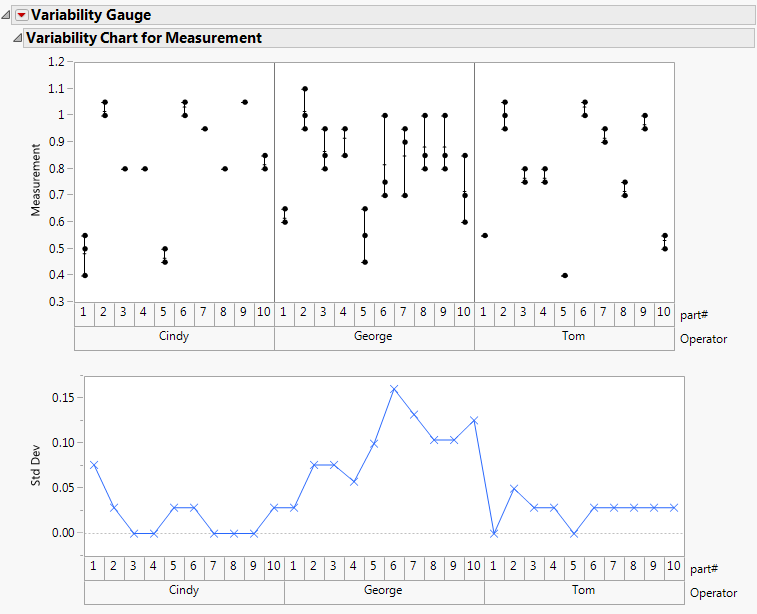
Figure 8.1 Example of a Variability Chart
Get JMP 13 Quality and Process Methods now with the O’Reilly learning platform.
O’Reilly members experience books, live events, courses curated by job role, and more from O’Reilly and nearly 200 top publishers.

