Example of a Contour Plot
You have data about diamonds, including their carat weight and price. Examine the relationship between carat weight and price.
1. Select Help > Sample Data Library and open Diamonds Data.jmp.
2. Select Graph > Graph Builder.
3. Select Price and drag it to the Y zone.
4. Select Carat Weight and drag it to the X zone.
Figure 4.2 Points Showing Diamond Characteristics
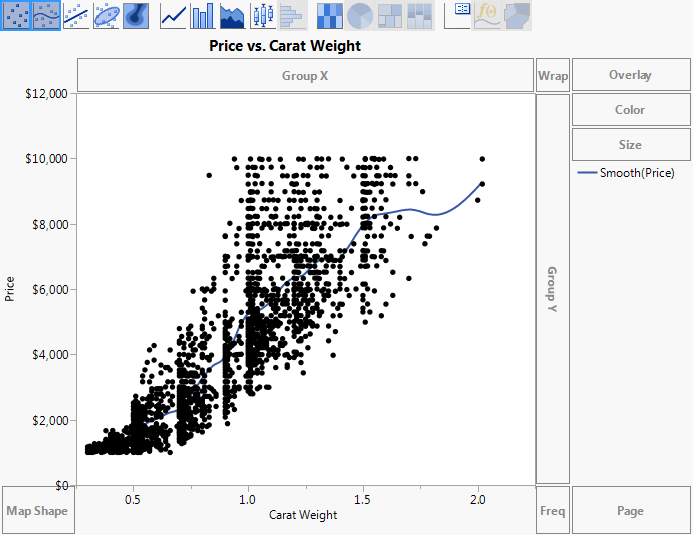
You can see that the points are difficult to interpret. Some points overlap, making the density unclear.
Replace the points with a contour plot of their density.
5. Right-click the plot and select Points > Change to > Contour.
6. (Optional) Click Done.
Get JMP 13 Essential Graphing now with the O’Reilly learning platform.
O’Reilly members experience books, live events, courses curated by job role, and more from O’Reilly and nearly 200 top publishers.

