Chapter 4
Graph Builder Examples
Visualize Data Interactively
Graph Builder provides you with a variety of flexible ways to explore your data. This chapter shows examples of examining data using contour plots, bar charts, histograms, area plots, treemaps, and other types of plots.
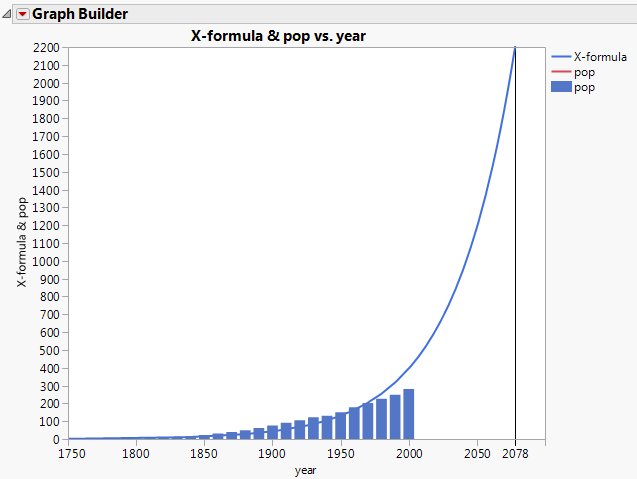
Figure 4.1 Example Using a Formula, Bars, and a Reference Line
Get JMP 13 Essential Graphing now with the O’Reilly learning platform.
O’Reilly members experience books, live events, courses curated by job role, and more from O’Reilly and nearly 200 top publishers.

