Example of Bivariate Analysis
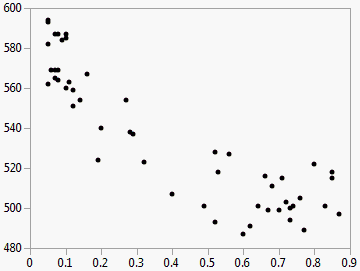
This example uses the SAT.jmp sample data table. SAT test scores for students in the 50 U.S. states, plus the District of Columbia, are divided into two areas: verbal and math. You want to find out how the percentage of students taking the SAT tests is related to verbal test scores for 2004.
1. Select Help > Sample Data Library and open SAT.jmp.
2. Select Analyze > Fit Y by X.
3. Select 2004 Verbal and click Y, Response.
4. Select % Taking (2004) and click X, Factor.
5. Click OK.
Figure 5.2 Example of SAT Scores by Percent Taking

You can see that the verbal scores were higher when a smaller percentage of the population ...
Get JMP 13 Basic Analysis now with the O’Reilly learning platform.
O’Reilly members experience books, live events, courses curated by job role, and more from O’Reilly and nearly 200 top publishers.

