Chapter 4
Overlay Plots
Plot Several Numeric Y Variables against One X Variable
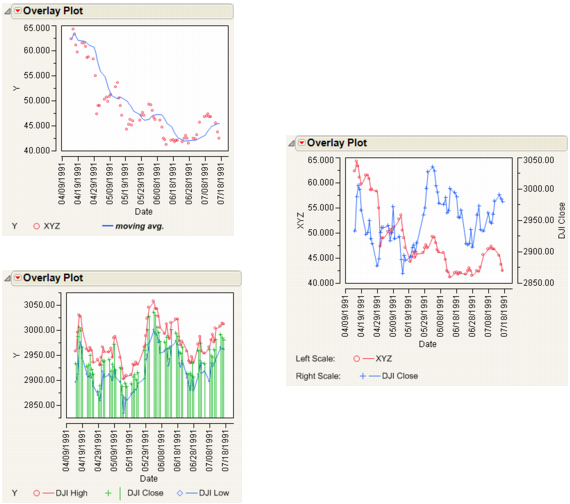
The Overlay Plot command in the Graph menu produces plots of a single X column and one or more numeric Ys and does not accept non-numeric values for the y-axis. Curves can also be shown as separate plots for each Y with a common x-axis. Plots can be modified with range and needle options, color, log axes, and grid lines. Curves with two different scales can be overlaid on the same plot with the addition of a right axis.
Figure 4.1 Examples of Overlay Plot Graphs
Get JMP 12 Essential Graphing now with the O’Reilly learning platform.
O’Reilly members experience books, live events, courses curated by job role, and more from O’Reilly and nearly 200 top publishers.

