Chapter 11
Pareto Plots
Focus Improvement Efforts on the Vital Few
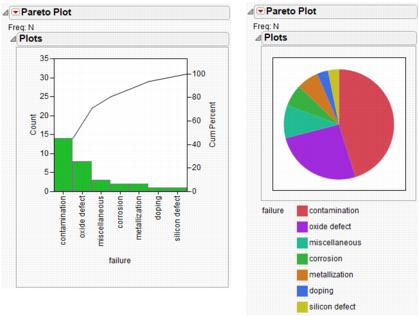
Improve the statistical quality of your process or operation using Pareto plots. A Pareto plot is a chart that shows severity (frequency) of problems in a quality-related process or operation. Pareto plots help you decide which problems to solve first by highlighting the frequency and severity of problems.
Figure 11.1 Pareto Plot Examples
Get JMP 11 Quality and Process Methods now with the O’Reilly learning platform.
O’Reilly members experience books, live events, courses curated by job role, and more from O’Reilly and nearly 200 top publishers.

