Chapter 5
Surface Plot
Explore Contours of Responses across Three Factors
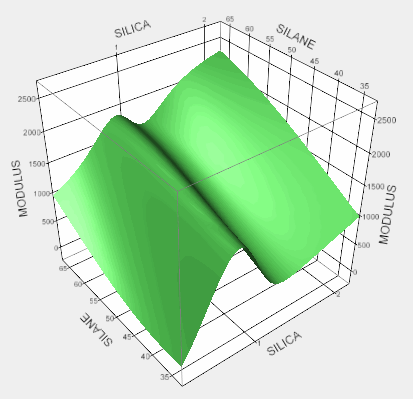
The Surface Plot platform functions both as a separate platform and as an option in model fitting platforms. Up to four dependent surfaces can be displayed in the same plot. The dependent variables section, below the plot, has four rows that correspond to the four surfaces. Depending on what you choose to view (sheets, points, isosurfaces, or density grids) and whether you supply a formula variable, different options appear in the dependent variables section.
Figure 5.1 Example of a Surface Plot
Get JMP 11 Profilers now with the O’Reilly learning platform.
O’Reilly members experience books, live events, courses curated by job role, and more from O’Reilly and nearly 200 top publishers.

