Contents
Launch the Platform
To generate a multivariate control chart, select Analyze > Quality And Process > Control Chart > Multivariate Control Chart.
Figure 7.2 Multivariate Control Chart Launch Window
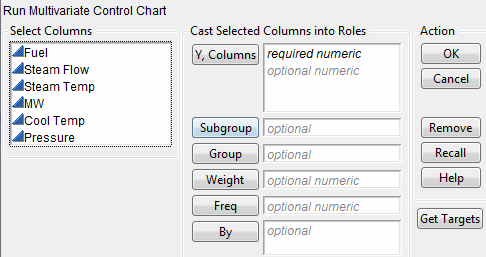
Y, Columns
are the columns to be analyzed.
Subgroup
is a column that specifies group membership. Hierarchically, this group is within Group.
Group
is a column that specifies group ...
Get JMP 10 Quality and Reliability Methods now with the O’Reilly learning platform.
O’Reilly members experience books, live events, courses curated by job role, and more from O’Reilly and nearly 200 top publishers.

