Chapter 17
Creating Parallel Plots
Using the Parallel Plot Platform
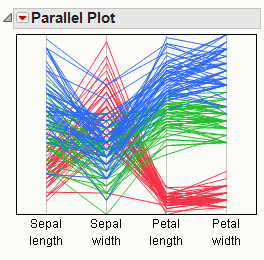
Using parallel plots, you can visualize each cell in a data table. Parallel plots draw connected line segments that represent each row in a data table. Parallel plots were initially developed by Inselberg (1985) and later popularized by Wegman (1990).
Figure 17.1 Example of a Parallel Plot
Get JMP 10 Basic Analysis and Graphing, Second Edition now with the O’Reilly learning platform.
O’Reilly members experience books, live events, courses curated by job role, and more from O’Reilly and nearly 200 top publishers.

