Chapter 2
Performing Univariate Analysis
Using the Distribution Platform
The Distribution platform describes the distribution of variables using histograms, additional graphs, and reports. You can examine the distribution of several variables at once. The report content for each variable varies, depending on whether the variable is categorical (nominal or ordinal) or continuous.
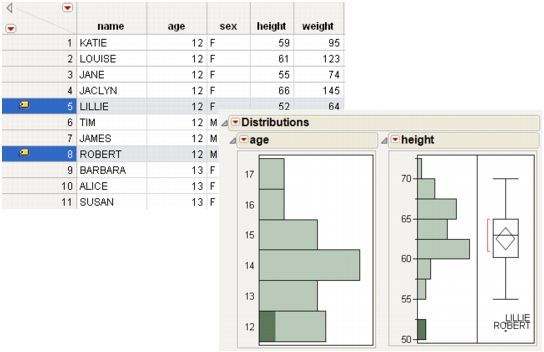
The Distribution report window is interactive. Clicking on a histogram bar highlights the corresponding data in any other histograms and in the data table. See Figure 2.1.
Figure 2.1 Example of the Distribution Platform
Get JMP 10 Basic Analysis and Graphing, Second Edition now with the O’Reilly learning platform.
O’Reilly members experience books, live events, courses curated by job role, and more from O’Reilly and nearly 200 top publishers.

