- Run jvisualvm from the <JDK_HOME>/bin folder:

Figure 11.1: Java VisualVM profiler
VisualVM lists all the Java processes that can be profiled by it on the local machine under the Local node. You can see VisualVM itself listed along with Eclipse.
- Once you run the CourseManagement application, the process should also show up under Local:
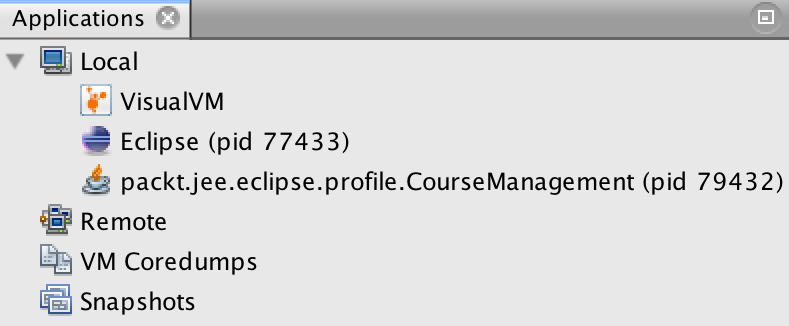
Figure 11.2: The CourseManagement application available for profiling
- Double-click on the process (or right-click and select Open). Then, go to the Profile tab and click on ...

