Creating more elaborate reports
In the previous section, we created a fairly simple database report. In this section, we will modify that report to illustrate how to add images, charts, and multiple columns to a report. We will also see how to group report data. We will perform all of these tasks graphically with iReport.
Adding images to a report
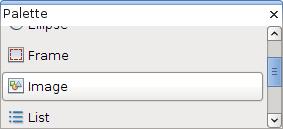
Adding static images to a report is very simple with iReport. Just drag the Image component from the Palette to the band where it will be rendered in the report.

When we drop the image component into the appropriate band, a window pops up asking us to specify the location of the image file to display.
After ...
Get JasperReports 3.5 for Java Developers now with the O’Reilly learning platform.
O’Reilly members experience books, live events, courses curated by job role, and more from O’Reilly and nearly 200 top publishers.

