Chapter 4. Tables, Sorting, and Grouping
Introduction
Chapter 3 covered many techniques for solving user interface problems. This chapter focuses specifically on ways to use HTML tables to solve a number of presentation-related problems.
The chapter starts by showing you some clever ways of using tables for simple histogram-style bar charts. The techniques in these recipes can liven data reporting web pages without relying on complex graphics generation.
A number of recipes discuss problems and solutions applicable to displaying tabular data in a grid. The recipes will show you how to alternate row colors in tables for improved readability, sort the displayed by clicking on a table header, and separate rows of data onto separate pages. You will find a recipe that combines all of these features using an easy-to-use open source tag library.
4.1. Creating a Horizontal Bar Chart
Problem
You want to create a simple data-driven horizontal bar chart on a web page without using an applet or graphics library.
Solution
Use nested
HTML
tables with the width percentages calculated
dynamically:
<table border="0">
  <logic:iterate id="row" name="foo" property="bar">
    <tr>
      <td align="right" width="20%">
        <bean:write name"row" property="label"/>
      </td>
      <td align="left" width="80%">
        <table width='<bean:write name="row"
                              property="percentage"/>%'
             bgcolor="blue">
          <tr>
            <td align="right">
              <font color="white">
                <bean:write name="row"
                        property="percentage"/>%
              </font>
            </td>
          </tr>
        </table>
      </td>
    </tr>
  </logic:iterate>
</table>
Discussion
Displaying tables of raw numeric data may satisfy the functional requirements of your application, but outputting this information in a graph can make a tremendous difference to your end users. However, as soon as you start talking about graphics, the groans begin. Should you buy a reporting engine? What about a graphics-rendering framework? Do you need both? In many situations, if your application requirements can be met fairly by bar graphs, a combination of some clever HTML and Struts can do the work for you.
Consider a web application that displays weather forecast
information. The application needs to display a bar chart that shows
the chance of precipitation for the upcoming week.
You’ll create the WeeklyWeather
class that holds the weather forecast as shown Example 4-1.
package com.oreilly.strutsckbk.ch04;

import java.util.ArrayList;
import java.util.List;

public class WeeklyWeather {

    public WeeklyWeather( ) {
        weekForecast = new ArrayList( );
        weekForecast.add(new DailyForecast("Sunday", 70));
        weekForecast.add(new DailyForecast("Monday", 40));
        weekForecast.add(new DailyForecast("Tuesday", 20));
        weekForecast.add(new DailyForecast("Wednesday", 5));
        weekForecast.add(new DailyForecast("Thursday", 50));
        weekForecast.add(new DailyForecast("Friday", 40));
        weekForecast.add(new DailyForecast("Saturday", 90));
    }

    public List getWeekForecast( ) {
        return weekForecast;
    }

    private List weekForecast;
}
The WeeklyWeather class uses the
DailyForecast class, shown in Example 4-2, to encapsulate the pairing of the day and the
chance of precipitation,
package com.oreilly.strutsckbk.ch04;

public class DailyForecast {

    public DailyForecast(String day, int chanceOfPrecip) {
        this.day = day;
        this.chancePrecip = chanceOfPrecip;
    }

    public int getChancePrecip( ) {
        return chancePrecip;
    }

    public void setChancePrecip(int chancePrecip) {
        this.chancePrecip = chancePrecip;
    }
    public String getDay( ) {
        return day;
    }
    public void setDay(String day) {
        this.day = day;
    }

    private String day;
    private int chancePrecip;

}
Now that the Model has been created for the application, the JSP (horizontal_chart.jsp) to render the chart can be written as shown in Example 4-3.
<%@ page contentType="text/html;charset=UTF-8" language="java" %>
<%@ taglib uri="http://jakarta.apache.org/struts/tags-bean" prefix="bean" %>
<%@ taglib uri="http://jakarta.apache.org/struts/tags-logic" prefix="logic" %>
<%@ taglib uri="http://java.sun.com/jstl/core" prefix="c" %>

<html>
<head>
  <title>Struts Cookbook - Chapter 04</title>
</head>
<body bgcolor="white">
<h2>Struts Cookbook Chapter 4 Examples</h2>
<div align="center">
  <hr />
  <h3>Color Bar Chart (horizontal)</h3>
  <jsp:useBean id="weeklyWeather"
            class="com.oreilly.strutsckbk.ch04.WeeklyWeather"/>
  <table border="0" width="60%">
  <logic:iterate id="dayEntry" name="weeklyWeather" property="weekForecast">
    <tr>
      <td align="right" width="20%">
        <bean:write name="dayEntry" property="day"/></td>
      <td align="left" width="80%">
        <table width='<bean:write name="dayEntry"
                              property="chancePrecip"/>%'
             bgcolor="#003366">
          <tr>
            <td align="right">
              <font color="white">
                <bean:write name="dayEntry"
                        property="chancePrecip"/>%
            </font>
            </td>
          </tr>
        </table>
      </td>
    </tr>
  </logic:iterate>
  </table>
</div>
</body>
</html>
Figure 4-1 shows the resultant web page.
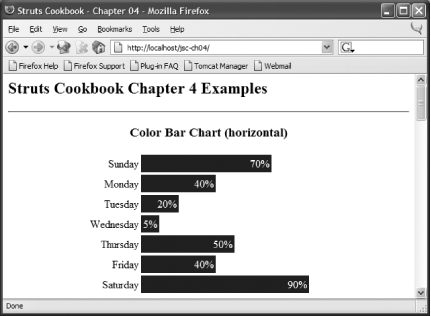
The horizontal chart is generated by iterating over the
weekForecast property of the
WeeklyWeather bean. A row of the table is
generated for each element of the weekForecast
property, with each row consisting of two columns. The first
(left-most) column holds the name of the day of the week, and the
second column displays the bars of the graph. The JSP page enables
the graphing magic by specifying a nested HTML table within the cell.
The nested table uses the chancePrecip property of
the DailyForecast to set the width of the table as
a percentage:
<table width='<bean:write name="dayEntry"
                      property="chancePrecip"/>%'
     bgcolor="#003366">
This percentage indicates the fractional amount of space that the
table will occupy within the containing table cell. This nested table
is then filled to this percentage with the background color specified
by the bgcolor attribute. The actual content of
this inner table is the percentage value text. By displaying the
numeric percentage along with the graphic, you can pack a lot of
information in a small space. If you didn’t want to
display the raw percentage data here, you could have set the cell
contents to a nonblank space:
<td> </td>
In the Solution and in the Weekly Forecast example, the data to be graphed were in the form of a percentage value. The value was used without modification as the width percentage for the table. In many cases, the data is not a percentage but a raw scalar value. The main purpose for the chart may be to show a relative comparison of the data. You can compute the percentage value for the table width using simple arithmetic.
Continuing with the weather theme, suppose that you wanted to display the expected number of inches of rainfall per day for next week (starting with Sunday). Here is the raw forecast data from the weather service:
|
Day of week |
Rainfall (inches) |
|
Sunday |
1.5 |
|
Monday |
2.0 |
|
Tuesday |
1.0 |
|
Wednesday |
0.2 |
|
Thursday |
0.8 |
|
Friday |
1.0 |
|
Saturday |
3.0 |
To turn these values into percentages for comparison purposes, you would use the following formula:
Percentage = (rainfall / max(rainfall)) * 100
With this formula, the day with the maximum
rainfall amount will yield a percentage of 100 percent. Since the
percentage calculation is used for presentation purposes, performing
the calculation on the JSP page is acceptable. The
JSP expression language (EL) available
with JSTL supports arithmetic. EL does not, however, provide an easy
way to calculate the maximum value. You will code this calculation to
the WeeklyForecast Java class.
You’ll want to add the
rainfallAmount float property to the
DailyForecast object. Then,
you’ll want to add a method to the
WeeklyForecast that calculates and returns the
maximum rainfall.
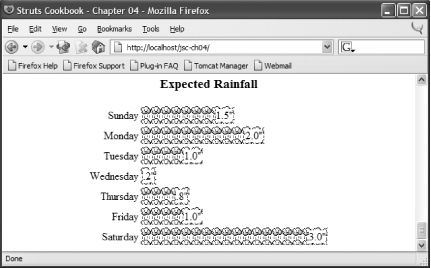
Now you can use this data to create the bar graph. Example 4-4 shows the JSP page
(horizontal_chart_jstl.jsp) to create the graph.
In addition to its calculation abilities, the JSTL
fmt:formatNumber tag formats the text representing
the numeric value. This page shows how to use an image instead of
background color to fill the graph.
<%@ page contentType="text/html;charset=UTF-8" language="java" %>
<%@ taglib uri="http://jakarta.apache.org/struts/tags-bean" prefix="bean" %>
<%@ taglib uri="http://jakarta.apache.org/struts/tags-logic" prefix="logic" %>
<%@ taglib uri="http://java.sun.com/jstl/core" prefix="c" %>
<%@ taglib uri="http://java.sun.com/jstl/fmt" prefix="fmt" %>

<html>
<head>
  <title>Struts Cookbook - Chapter 04</title>
</head>
<body bgcolor="white">
<h2>Struts Cookbook Chapter 4 Examples</h2>
<div align="center">
  <h3>Expected Rainfall</h3>
  <table border="0" width="60%">
  <c:forEach var="dayEntry" items="${weeklyWeather.weekForecast}">
    <tr>
      <td align="right" width="20%">
        <bean:write name="dayEntry" property="day"/>
      </td>
      <td align="left" width="80%">
        <table background="images/raincloud.gif"
           width="<c:out value='${(dayEntry.rainfall div weeklyWeather.
           maxRainfall) * 100}'/>%">
          <tr>
            <td align="right">
              <span style="{color:black;background-color:white}">
                <fmt:formatNumber value="${dayEntry.rainfall}"
                pattern="##.0"/>"
              </span>
            </td>
           </tr>
        </table>
      </td>
    </tr>
  </c:forEach>
  </table>
</div>
</body>
</html>
The key to making the chart work is the calculation of the width percentage using JSTL:
width="<c:out value='${(dayEntry.rainfall div weeklyWeather.
maxRainfall) * 100}'/>%
The rendered bar chart is shown in Figure 4-2; it’s obviously going to be a wet week.
See Also
The graphics shown in this recipe are created through a clever use of HTML. More complex graphics can be created by dynamically generating actual graphic images using graphic support provided by Java. Jason Hunter shows some of these techniques in Java Servlet Programming (O’Reilly).
If you are unfamiliar with JSTL you’ll want to check out Recipe 3.1. Recipe 4.2 demonstrates how to render a more traditional vertical bar chart.
4.2. Creating a Vertical Bar Chart
Problem
You want to create a data-driven vertical bar chart on a web page without having to use an applet or a graphics library.
Solution
Use
nested
HTML tables with the height percentages calculated
dynamically:
<table height="500" width="60%">
  <tr>
    <logic:iterate id="row"
                 name="foo"
             property="bar">
      <td valign="bottom">
        <table height='<bean:write name="row"
                               property="percentage"/>%'
                width="100%" bgcolor="#003366">
          <tr>
            <td align="center" valign="top">
              <font color="white">
                <bean:write name="row"
                        property="percentage"/>%
              </font>
            </td>
          </tr>
        </table>
      </td>
    </logic:iterate>
  </tr>
  <tr align="center" height="10%">
    <logic:iterate id="row"
                 name="foo"
             property="bar">
      <td align="center" width="50">
        <bean:write name="row" property="label"/>
      </td>
    </logic:iterate>
  </tr>
</table>
Discussion
In Recipe 4.1, the chart is generated using
a logic:iterate loop. On each pass through the
loop, a table row is generated. The first column of the each row
holds the label, and the second column contains the bar graph. The
graph is generated using a numeric value to specify the width
percentage for a nested table that has a different background color.
A vertical bar chart can be thought of as a horizontal bar chart flipped on its side. The table for a horizontal chart has n rows by two columns, in which n is the size of the Collection being iterated over, and the two columns are for the label and the bar. The vertical bar chart, on the other hand, uses n columns by two rows. Instead of each pass through the loop generating a row, each pass generates a column. So, to generate a vertical bar chart, you use two iteration loops. The first loop generates the top row containing the bars. The second loop generates the bottom row containing the labels.
The mechanism for creating the bar is similar to that used for the horizontal bar chart: a table is nested within a table cell. For the vertical chart, the height percentages are set instead of the width.
<table height='<bean:write name="dayEntry"
                       property="chancePrecip"/>%'
        width="100%" bgcolor="#003366">
You should locate the text containing the numeric value for each bar
at the top end of the graphic. You set the value of the
valign attribute for the td
cell to top to get this alignment.
A concrete example helps pull this all together. You can use the same
WeeklyForecast JavaBean and related classes that
are used in Recipe 4.1 (shown in Examples
Example 4-1 and Example 4-2). Example 4-5 shows the JSP page
(vertical_chart.jsp) that generates the vertical
bar chart.
<%@ page contentType="text/html;charset=UTF-8" language="java" %>
<%@ taglib uri="http://jakarta.apache.org/struts/tags-bean" prefix="bean" %>
<%@ taglib uri="http://jakarta.apache.org/struts/tags-logic" prefix="logic" %>
<%@ taglib uri="http://java.sun.com/jstl/core" prefix="c" %>

<html>
<head>
  <title>Struts Cookbook - Chapter 04</title>
</head>
<body bgcolor="white">
<h2>Struts Cookbook Chapter 4 Examples</h2>
<div align="center">
  <hr />
  <h3>Color Bar Chart (vertical)</h3>
  <table height="500" width="60%">
    <tr>
      <logic:iterate id="dayEntry"
                   name="weeklyWeather"
               property="weekForecast">
        <td valign="bottom">
          <table height='<bean:write name="dayEntry"
                                 property="chancePrecip"/>%'
                  width="100%" bgcolor="#003366">
            <tr>
              <td align="center" valign="top">
                <font color="white">
                  <bean:write name="dayEntry"
                          property="chancePrecip"/>%
                </font>
              </td>
            </tr>
          </table>
        </td>
      </logic:iterate>
    </tr>
    <tr align="center" height="10%">
      <logic:iterate id="dayEntry"
                   name="weeklyWeather"
               property="weekForecast">
        <td align="center" width="50">
          <bean:write name="dayEntry" property="day"/>
        </td>
      </logic:iterate>
    </tr>
  </table>
</div>
</body>
</html>
The rendered chart is shown in Figure 4-3.
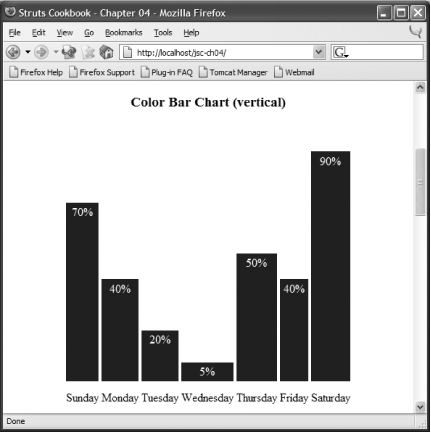
If you look closely, you’ll notice that the width of the bars is inconsistent. That’s because the width of the label (day of week) displayed on the bottom row determines the width for the each column. You can normalize the column widths by specifying a size large enough to hold the widest label. Alternatively, you can calculate—using Struts and JSTL—a uniform percentage for the width—which you can apply to each column.
You use the Struts bean:size tag to create a
scoped variable whose value is the number of columns. Then use a JSTL
expression to turn that value into a percentage:
<bean:size id="cols" name="weeklyWeather" property="weekForecast"/>
<tr align="center" height="10%">
  <logic:iterate id="dayEntry" name="weeklyWeather" property="weekForecast">
    <td align="center" width="<c:out value='${100 div cols}'/>%">
      <bean:write name="dayEntry" property="day"/>
    </td>
  </logic:iterate>
</tr>
See Also
Recipe 4.1 shows how to create similar charts as in this example but with a horizontal bar graph. Recipe 3-1 shows how to use JSTL in your Struts application.
4.3. Alternating Table Row Colors
Problem
You need to build an HTML table where the rows alternate in color or style.
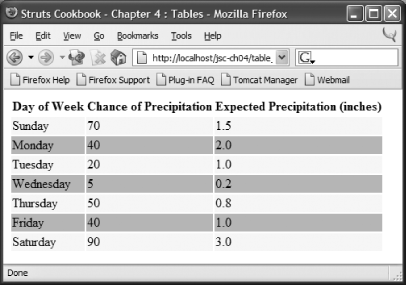
Solution
Example 4-6 shows a JSP page (struts_table.jsp) that uses Struts tags to display tabular data where the background colors alternate between orange and yellow.
<%@ page contentType="text/html;charset=UTF-8" language="java" %>
<%@ taglib uri="http://jakarta.apache.org/struts/tags-bean" prefix=
  "bean" %>
<%@ taglib uri="http://jakarta.apache.org/struts/tags-logic" prefix=
  "logic" %>
  <html>
<head>
  <title>Struts Cookbook - Chapter 4 : Tables</title>
  <style>
  /* Even row */
  .row1 {background-color:orange;}

  /* Odd row */
  .row0 {background-color:yellow;}
  </style>
</head>
<body>
  <jsp:useBean id="weeklyWeather"
            class="com.oreilly.strutsckbk.ch04.WeeklyWeather"/>
  <table>
    <tr>
      <th>Day of Week</th>
      <th>Chance of Precipitation</th>
      <th>Expected Precipitation (inches)</th>
    </tr>
    <logic:iterate id="forecast" indexId="count"
                 name="weeklyWeather" property="weekForecast">
      <tr>
        <td class='row<%= count.intValue( ) % 2 %>'>
          <bean:write name="forecast" property="day"/>
        </td>
        <td class='row<%= count.intValue( ) % 2 %>'>
          <bean:write name="forecast" property="chancePrecip"/>
        </td>
        <td class='row<%= count.intValue( ) % 2 %>'>
          <bean:write name="forecast" property="rainfall"/>
        </td>
      </tr>
    </logic:iterate>
  </table>
</body>
</html>
Example 4-7 (jstl_table.jsp) shows a cleaner solution that uses JSTL EL instead of relying on JSP scriptlet.
<%@ page contentType="text/html;charset=UTF-8" language="java" %>
<%@ taglib uri="http://java.sun.com/jstl/core" prefix="c" %>
<html>
<head>
  <title>Struts Cookbook - Chapter 4 : Tables</title>
  <style>
  /* Even row */
  .evenRow {background-color:orange;}

  /* Odd row */
  .oddRow {background-color:yellow;}
  </style>
</head>
<body>
  <jsp:useBean id="weeklyWeather"
            class="com.oreilly.strutsckbk.ch04.WeeklyWeather"/>
  <table>
    <tr>
      <th>Day of Week</th>
      <th>Chance of Precipitation</th>
      <th>Expected Precipitation (inches)</th>
    </tr>
    <c:forEach var="forecast"
             items="${weeklyWeather.weekForecast}"
         varStatus="loop">
      <c:set var="tdclass" value="oddRow"/>
      <c:if test="${loop.count % 2 == 0}">
        <c:set var="tdclass" value="evenRow"/>
      </c:if>
      <tr>
        <td class='<c:out value="${tdclass}"/>'>
          <c:out value="${forecast.day}"/>
        </td>
        <td class='<c:out value="${tdclass}"/>'>
          <c:out value="${forecast.chancePrecip}"/>
        </td>
        <td class='<c:out value="${tdclass}"/>'>
          <c:out value="${forecast.rainfall}"/>
        </td>
      </tr>
    </c:forEach>
  </table>
</body>
</html>
Discussion
It doesn’t take a usability expert to show you that
alternating the color or style of tabular data rows makes the table
more readable. Both approaches shown in the Solution—the first
using Struts tags and the second using JSTL—render a table with
alternating row colors. In each approach, the
style element in the head
defines two styles for alternation. In the first approach, the styles
are identified as row1 and
row0. The logic:iterate
loop iterates over the data Collection. The
indexId attribute creates a scripting variable
that holds the current value of the loop index. This value starts at
and increments by one on each iteration of the loop. The modulus
(remainder) operation is used to calculate a 0 or 1. The style to use
is specified by concatenating row to the calculated modulus:
class='row<%= count.intValue( ) % 2 %>
Since count is a
java.lang.Integer object, you must use the
intValue( ) method when performing the
calculation. The calculation returns the remainder from dividing
count by 2. Therefore, if the loop index is an
even number—2, 4, etc.—then the style ID for the
class attribute will be
row0. If the loop index is an odd number,
row1 will be used. The result is that the
rows alternate in color. Figure 4-4 shows the
rendered page generated by the first approach.
The use of Cascading Style Sheet (CSS) styles makes this solution flexible. The style allows for a myriad of presentation effects to be applied in addition to the basic background color. However, this solution does force you to name each style in a contrived fashion—the name must end in a 0 or 1.
The second approach uses JSTL only, and no Struts tags are used. The
generated HTML is identical to the first, but three significant
differences occur between the JSTL approach and the Struts-based one.
First, the remainder calculation to determine if a row is odd or even
is handled using EL instead of scriptlet. Second, the
c:if tag directly determines the style to apply;
you aren’t forced to name the styles
row0 and row1.
The third difference is subtle, yet important. When the
varStatus attribute is used, the
c:forEach loop exposes an object that indicates
the status of the loop. This object has properties that represent the
index of the underlying collection and the
count of the number of loops that have occurred.
This property is useful if the c:forEach iterates
over a portion of a collection by specifying the
begin, end, or
step attributes. For example, consider the
following c:forEach loop:
<c:forEach var="bar" items="fooList" begin="3" step="2"
  varStatus="loopStat">
    Index: <c:out value="${loopStat.index}"/><br />
    Count: <c:out value="${loopStat.count}"/> <br />
</c:forEach>
This loop starts with the fourth element
(begin="3“) and displays every other element
(step="2“). The output from this loop would look
something like:
Index: 3
Count: 1
Index: 5
Count: 2
Index: 7
Count: 3
...
If the index, instead of the count, were used to calculate the modulus, the colors would never alternate.
See Also
Recipe 3.1 provides the basics needed to use JSTL in your application. Recipe 4.4 shows how to sort data in an HTML table by clicking on a row header. Recipe 4-6 shows you how to create the effects shown in this recipe using the display tags open source tag library.
4.4. Sorting HTML Tables
Problem
You need to sort the results of a displayed table by clicking on a column header.
Solution
Create an Action, as shown in Example 4-8, that uses the
BeanComparator class of the Jakarta Commons
BeanUtils library to sort the underlying Collection.
package com.oreilly.strutsckbk.ch04;

import java.util.ArrayList;
import java.util.Collections;
import java.util.Comparator;
import java.util.List;

import javax.servlet.http.HttpServletRequest;
import javax.servlet.http.HttpServletResponse;

import org.apache.commons.beanutils.BeanComparator;
import org.apache.commons.collections.comparators.ReverseComparator;
import org.apache.struts.action.Action;
import org.apache.struts.action.ActionForm;
import org.apache.struts.action.ActionForward;
import org.apache.struts.action.ActionMapping;

public class ViewForecastAction extends Action {

  public ActionForward execute(ActionMapping mapping,
      ActionForm form,
      HttpServletRequest request,
      HttpServletResponse response) throws Exception {
    // create the weather bean
    WeeklyWeather weather = new WeeklyWeather( );

    // create a list to hold the forecast
    List list = new ArrayList( );
    list.addAll( weather.getWeekForecast( ) );

    // get the sort by request param
    String sortBy = request.getParameter("sortBy");

    // get the reverse request param
    boolean reverse = false;
    String reverseParam = request.getParameter("reverse");
    if (reverseParam != null)
        reverse = Boolean.valueOf(reverseParam).booleanValue( );

    // sort the list
    if (sortBy != null) {
      Comparator comparator = new BeanComparator(sortBy);
      if(reverse) comparator = new ReverseComparator(comparator);
      Collections.sort( list, comparator );
    }

    // add the list as a request attribute and forward to the JSP
    request.setAttribute( "weekForecast", list );
    return mapping.findForward("success");
  }
}
Then create an action element in the
struts-config.xml that uses
ViewForecastAction and forwards to the JSP page
that displays the table:
<action path="/ViewForecast"
        type="com.oreilly.strutsckbk.ch04.ViewForecastAction">
    <forward name="success" path="/sorted_struts_table.jsp"/>
</action>
On the JSP page (sorted_struts_table.jsp), shown
in Example 4-9, the table header cells contain links
to the ViewForecast action. Each link sets request
parameters that indicate the property name to sort by and if the sort
order is reversed (i.e., descending).
<%@ page contentType="text/html;charset=UTF-8" language="java" %>
<%@ taglib uri="http://jakarta.apache.org/struts/tags-bean" prefix=
  "bean" %>
<%@ taglib uri="http://jakarta.apache.org/struts/tags-logic" prefix=
  "logic" %>
  <html>
<head>
  <title>Struts Cookbook - Chapter 4 : Sorted Struts Table</title>
</head>
<body>
  <table width="60%" border="2">
    <tr>
      <th>Day of Week<br />
        <a href="ViewForecast.do">unsort</a>
      </th>
      <th>Chance of Precipitation<br />
        <a href="ViewForecast.do?sortBy=chancePrecip">asc</a>
        <a href="ViewForecast.do?sortBy=chancePrecip&reverse=true">desc</a>
      </th>
      <th>Expected Precipitation (inches)<br />
        <a href="ViewForecast.do?sortBy=rainfall">asc</a>
        <a href="ViewForecast.do?sortBy=rainfall&reverse=true">desc</a>
      </th>
    </tr>
    <logic:iterate id="forecast" name="weekForecast">
      <tr>
        <td>
          <bean:write name="forecast" property="day"/>
        </td>
        <td>
          <bean:write name="forecast" property="chancePrecip"/>
        </td>
        <td>
          <bean:write name="forecast" property="rainfall"/>
        </td>
      </tr>
    </logic:iterate>
  </table>
</body>
</html>
Discussion
The approach shown in the solution performs an in-memory sort of the data displayed in an HTML table.
Tip
If the tabular data were stored in a database, you would need to store the data collection in the session or refetch the data from the database between requests.
The table is sorted by creating a
java.util.Comparator based on the name of the
property to sort by. The BeanComparator class
provides the intelligence to create the comparator using JavaBean
introspection. The created Comparator sorts the
data based on the natural ordering of the property. If a reverse or
descending order sort is desired, a
ReverseComparator is created from the
BeanComparator.
The Solution for this problem is easy. The grunt work of creating the
Comparators is handled by the
BeanComparator. If you add a new property to the
object in the collection, it can be sorted by passing in a request
parameter with the name of that property. If you want to return the
collection to its natural, unsorted state, don’t
pass in the sortBy parameter.
Sorting in ascending or descending order is handled via the
reverse request parameter. This parameter is
mapped to a Boolean variable. If reverse is true,
a ReverseComparator is used.
The JSP page adds sorting capability by providing links that forward
to the ViewForecast action. Each link specifies a
sortBy parameter corresponding to the column to be
sorted. The link for sorting in descending order adds the
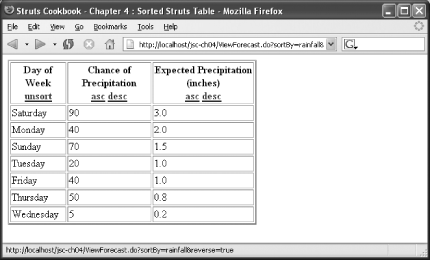
reverse parameter. Figure 4-5
shows the resultant web page for the Solution. Here the
“desc” link in the third column was
clicked to order the data by greatest expected rainfall. You can see
the generated URL for the “desc”
link in the browser’s status bar.
See Also
This Solution was based in-part on suggestions made in the struts-user mailing list. One useful thread posting by Henri Yandell is archived at http://www.mail-archive.com/struts-user%40jakarta.apache.org/msg95356.html.
JSTL tags can be used to create the table instead of the Struts
logic:iterate and bean:write
tags. Recipe 4.3 shows
examples of JSTL to create tables. Recipe 4.6 shows you how to provide table sorting using
the display tags open source tag library. You do
not need to code any special Java sorting actions if you use this
popular tag library.
For further information on the BeanUtils sorting capabilities, check out the JavaDocs at http://jakarta.apache.org/commons/beanutils/api/org/apache/commons/beanutils/BeanComparator.html.
4.5. Paging Tables
Problem
Instead of creating a long page to display a large number of tabular items, you want to display a limited fraction of the data on a page, allowing the user to navigate between the pages.
Solution
The simplest way to perform paging without resorting to a third-party
tag library is to leverage the arithmetic capabilities of JSTL EL and
the features of JSTL’s c:forEach
tag. The JSP page
(paged_data.jsp) of Example 4-10
presents a complete page that supports paging through a Collection.
<%@ page contentType="text/html;charset=UTF-8" language="java" %> <%@ taglib uri="http://jakarta.apache.org/struts/tags-bean" prefix= "bean" %> <%@ taglib uri="http://java.sun.com/jstl/core" prefix="c" %> <html> <head> <title>Struts Cookbook - Chapter 4 : Paging</title> </head> <body> <jsp:useBean id="pagedData" class="com.oreilly.strutsckbk.ch04. PagedData"/> <bean:size id="listSize" name="pagedData" property="data"/> <c:set var="pageSize" value="10"/> <c:set var="pageBegin" value="${param.pageBegin}"/> <c:set var="pageEnd" value="${pageBegin + pageSize - 1}"/> <c:if test="${(pageBegin - pageSize) ge 0}"> <a href='<c:url value="paged_data.jsp"> <c:param name="pageBegin" value="${pageBegin - pageSize}"/> </c:url>'> Prev </a> </c:if> <c:if test="${(listSize gt pageSize) and (pageEnd lt listSize)}"> <a href='<c:url value="paged_data.jsp"> <c:param name="pageBegin" value="${pageBegin + pageSize}"/> </c:url>'> Next </a> </c:if> <table border="2"> <tr> <th>First Name</th> <th>Last Name</th> <th>Term of Office</th> </tr> <c:forEach var="pres" items="${pagedData.data}" begin="${pageBegin}" end="${pageEnd}"> <tr> <td> <c:out value="${pres.firstName}"/> </td> <td> <c:out value="${pres.lastName}"/> </td> <td> <c:out value="${pres.term}"/> </td> </tr> </c:forEach> </table> </body> </html>
Discussion
An application’s usability improves when the user doesn’t have to scroll around, vertically or horizontally, to see all the data on a web page. For a business application, this usability, or lack thereof, can make a measurable difference in productivity. This recipe addresses the problem of displaying a collection of data of indeterminate length. This frequently occurs in database-driven applications where the data is rendered in tabular fashion.
The Solution provided can be completely implemented at the
presentation level. No requirements are made on the model of the data
or on any controller Actions that process the
data.
Warning
This solution provides presentation-level paging. It doesn’t restrict the data amount initially received from the underlying persistent store.
In the Solution, the data being paged through is hardcoded into the JavaBeans shown in Example 4-11. In a real application, these data would more likely come from a persistence store such as a database or filesystem.
package com.oreilly.strutsckbk.ch04;

import java.util.ArrayList;
import java.util.List;

public class PagedData {

    private List list;

    public PagedData( ) {
        list = new ArrayList( );
        list.add( new President( "Washington", "George", "1789-97") );
        list.add( new President( "Adams", "John", "1797-1801") );
        list.add( new President( "Jefferson", "Thomas", "1801-09") );
        list.add( new President( "Madison", "James", "1809-17") );
        list.add( new President( "Monroe", "James", "1817-25") );
        list.add( new President( "Jackson", "Andrew", "1829-37") );
        list.add( new President( "Van Buren", "Martin", "1837-41") );
        list.add( new President( "Harrison", "William Henry", "1841") );
        list.add( new President( "Tyler", "John", "1841-45") );
        list.add( new President( "Polk", "James", "1845-49") );
        list.add( new President( "Taylor", "Zachary", "1849-50") );
        list.add( new President( "Fillmore", "Millard", "1850-53") );
        list.add( new President( "Pierce", "Franklin", "1853-57") );
        list.add( new President( "Buchanan", "James", "1857") );
        list.add( new President( "Lincoln", "Abraham", "1861-65") );
        list.add( new President( "Johnson", "Andrew", "1865-69") );
        list.add( new President( "Grant", "Ulysses S.", "1869-77") );
        list.add( new President( "Hayes", "Rutherford B.", "1877-81") );
        list.add( new President( "Garfield", "James", "1881") );
        list.add( new President( "Arthur", "Chester", "1881-85") );
        list.add( new President( "Cleveland", "Grover", "1885-89") );
        list.add( new President( "Harrison", "Benjamin", "1889-93") );
        list.add( new President( "Cleveland", "Grover", "1893-97") );
        list.add( new President( "McKinley", "William", "1897-1901") );
        list.add( new President( "Roosevelt", "Theodore", "1901-09") );
        list.add( new President( "Taft", "William H.", "1909-13") );
        list.add( new President( "Wilson", "Woodrow", "1913-21") );
        list.add( new President( "Jackson", "Andrew", "1829-37") );
        list.add( new President( "Harding", "Warren", "1921-23") );
        list.add( new President( "Coolidge", "Calvin", "1923-29") );
        list.add( new President( "Hoover", "Herbert", "1929-33") );
        list.add( new President( "Roosevelt", "Franklin D.", "1933-45") );
        list.add( new President( "Truman", "Harry", "1945-53") );
        list.add( new President( "Eisenhower", "Dwight", "1953-61") );
        list.add( new President( "Kennedy", "John F.", "1961-63") );
        list.add( new President( "Johnson", "Lyndon", "1963-69") );
        list.add( new President( "Nixon", "Richard", "1969-74") );
        list.add( new President( "Ford", "Gerald", "1974-77") );
        list.add( new President( "Carter", "Jimmy", "1977-81") );
        list.add( new President( "Reagan", "Ronald", "1981-89") );
        list.add( new President( "Bush", "George H.W.", "1989-93") );
        list.add( new President( "Clinton", "William J.", "1993-2001") );
        list.add( new President( "Bush", "George W.", "2001-present") );
    }

    public List getData( ) {
        return list;
  }
}
The President class encapsulates information about
a president, as shown in Example 4-12.
package com.oreilly.strutsckbk.ch04;

public class President {
    public President(String lname, String fname, String term) {
        lastName = lname;
        firstName = fname;
        this.term = term;
    }

    public String getFirstName( ) {
        return firstName;
    }
    public void setFirstName(String firstName) {
        this.firstName = firstName;
    }
    public String getLastName( ) {
        return lastName;
    }
    public void setLastName(String lastName) {
        this.lastName = lastName;
    }
    public String getTerm( ) {
        return term;
    }
    public void setTerm(String term) {
        this.term = term;
    }

    private String lastName;
    private String firstName;
    private String term;
}
The JSP page (Example 4-10) contains all the logic
that handles paging. Though this JSP could have been implemented
using only Struts tags, it would have required a substantial amount
of scripting to perform the necessary arithmetic. A better approach
is to use JSTL. JSTL easily supports arithmetic calculations in
expressions; in addition, the JSTL c:forEach tag
is designed to allow for specification of beginning and ending
indices for the collection being iterated. This ability is a natural
fit for the requirements of paging.
Paging requires you to track the current page that the user is on.
When the page is initially displayed, you want to display the first
n rows, where n is the
desired page size. In the Solution, this
value—pageSize—is set to 10:
<c:set var="pageSize" value="10"/>
The JSP page is designed to accept a request parameter that
identifies the beginning index for the current page:
pageBegin. The ending index,
pageEnd, is calculated by adding the page size to
the value of the beginning index. The calculation subtracts 1 from
this result because the indices in a c:forEach
loop are zero-based.
<c:set var="pageEnd" value="${pageBegin + pageSize - 1}"/>The JSP page is designed to generate links for the previous and next pages. The link loops back to the current page with the URL query string containing the calculated beginning index. The beginning index for the link to the previous page is calculated as follows:
pageBegin - pageSize
The beginning index for the link to the next page is likewise calculated:
pageBegin + pageSize
Additionally, you don’t want the links to display if
they aren’t valid. In other words, you
don’t want a link to the previous page when you are
displaying the first page. Similarly, there
shouldn’t be a link to the next page when the last
page is displayed. For this requirement, the JSP page needs to know
the total size—essentially the number of rows—in the
list. This value is determined using the Struts
bean:size tag:
<bean:size id="listSize" name="pagedData" property="data"/>
The JSTL c:url tag is used to generate the
href attribute for the HTML links:
<a href='<c:url value="paged_data.jsp">
             <c:param name="pageBegin" value="${pageBegin - pageSize}"/>
         </c:url>'>
    Prev
</a>
This results in a link rendered something like the following:
<a href='paged_data.jsp?pageBegin=20'>
  Prev
</a>
Though the Struts html:link tag could have been
used, it doesn’t add any significant advantage over
using the JSTL c:url tag.
Tip
A good practice to use when building JSP pages is to minimize mixing tag libraries when it doesn’t add to the overall functionality of the page.
If you examine the Solution, you may notice what appears to be a
defect: the ending index is calculated by adding the beginning index
to the page size. With the examples, the list being iterated has over
42 elements—e.g., the number of U.S. presidents to date. The
first page displays elements 0-9, the second displays 10-19, etc. For
the last page, begin will be set to
40 and end will be set to
49. Yet only 42 elements are in the list:
end should be set to 41. Fear
not, for JSTL is smart enough not to overrun the list. When the
c:forEach loop reaches the end of the list, it
gracefully discontinues iteration regardless of the value of the
end attribute.
Now take a look at the resulting web pages. First, Figure 4-6 shows the rendered web page when the JSP page is initially accessed.
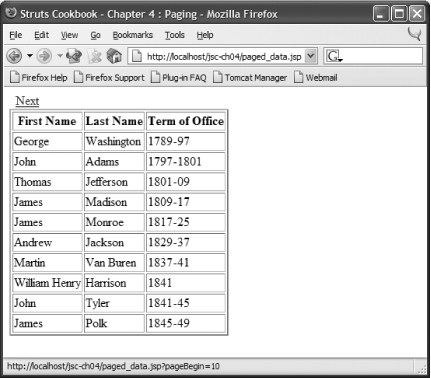
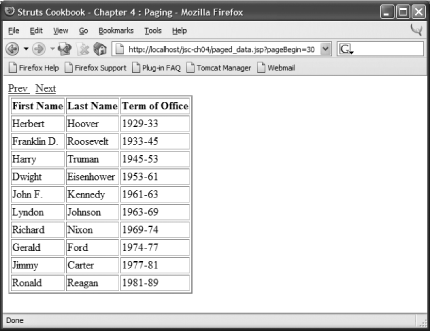
Figure 4-7 shows the web page after paging forward two pages to display the third page (the 31st through 40th presidents).
Though the Solution presented satisfies many application requirements, if the size of the data to be displayed is a large result set from a database and the number of rows could be significantly higher—say in the thousands—then you’ll need to consider additional alternatives. Look to your underlying persistence mechanism for solutions that manage large data sets at the persistence level.
See Also
The Pager Tag Library is a popular JSP tag library that supports paging. It provides a presentation that can emulate the paging style of search engines such as Google and Alta Vista. Information on this library can be found at http://jsptags.com/tags/navigation/pager/index.jsp.
The display tag library is an open source JSP tag library that is well suited for the display of tabular data. It supports paging in various manners and is discussed in Recipe 4.6.
4.6. Using the Display Tag Library
Problem
You want an easier way of displaying tabular data that supports paging and sorting.
Solution
Use the Display tag JSP tag library.
Example 4-13 shows a JSP page that displays the list of U.S. presidents using the model data from Recipe 4.5. This JSP page displays a table rendered using the display tag library. The displayed page has alternating table row colors, allows for paging, and offers column sorting, all without requiring any custom Java coding.
<%@ page contentType="text/html;charset=UTF-8" language="java" %>
<%@ taglib uri="http://displaytag.sf.net/el" prefix="display" %>
<html>
<head>
  <title>Struts Cookbook - Chapter 4 : Display Tag Example</title>
  <style>
  .even {background-color:orange;}
  .odd {background-color:yellow;}
  </style>
</head>
<body>
  <h2>Display Tag Examples</h2>
  <jsp:useBean id="pagedData" class="com.oreilly.strutsckbk.ch04.
    PagedData"/>
  <display:table id="pres" name="${pagedData.data}"
                 sort="list" pagesize="10" defaultsort="3">
    <display:caption>United States Presidents</display:caption>
    <display:setProperty name="basic.show.header" value="true"/>
    <display:column property="firstName" title="First Name"
                    sortable="true"/>
    <display:column property="lastName" title="Last Name"
                    sortable="true"/>
    <display:column property="term" title="Term of Office"
                    sortable="true"/>
  </display:table>
</body>
</html>
Discussion
The display tag library is an open source tag library that can be used to render highly functional displays of tabular data. The Solution shown above creates the page shown in Figure 4-8.
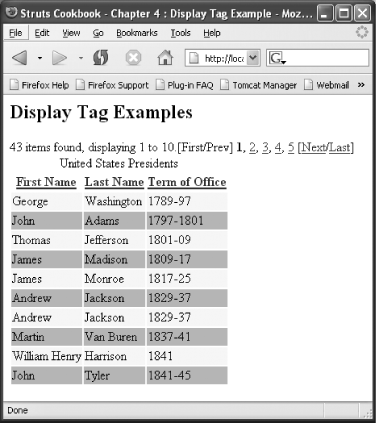
The web page shown in Figure 4-8 packs a lot of functionality for a table created using a handful of custom tags. If you compare this Solution to the previous recipes that were used to provide alternate row colors, paging, and sorting, you can see why this tag library has become quite popular.
Warning
This solution provides presentation-level paging. It doesn’t restrict the amount of data initially received from the underlying persistent store.
To use the display tag library, you will need to download it from http://displaytag.sourceforge.net. Once downloaded, copy the displaytag.jar file into your web application’s WEB-INF/lib folder. You will need to copy a tag library descriptor (.tld) file into this folder as well. The display tags provide a couple of choices here. The Solution uses the displaytags-el.tld file. These tags support JSTL expressions for attribute values.
The EL-version of the display tags requires that the jstl.jar and standard.jar JAR files be present in the WEB-INF/lib folder.
The display tag library depends on Version 2.0 or later of the Jakarta Commons Lang library, commons-lang-2.0.jar.
Tip
At the time of this writing, the Struts 1.1 distribution shipped with an earlier version of Commons Lang, and Struts 1.2 didn’t include any version of Commons Lang. You can download the commons-lang-2.0.jar from http://jakarta.apache.org/commons. Replace commons-lang.jar with commons-lang-2.0.jar in your web application’s WEB-INF/lib folder. From here on, you should not have any other incompatibility or dependency problems.
The display tags provide a lot of functionality
and are easy to use. First, the display:table tag
specifies information about the entire table:
<display:table id="pres" name="${pagedData.data}"
             sort="list" pagesize="10" defaultsort="3">
The id attribute creates a scoped variable that
can be used to refer to the current row. The name
attribute identifies the collection to be rendered. The
sort attribute indicates how the data should be
sorted: “list” indicates that the
entire list is sorted, and “page”
indicates that only the visible data on the current page is to be
sorted. The value of the pagesize attribute is the
number of rows to display per page.
The
defaultsort attribute
specifies the column (starting with 1) on which
the data is initially sorted. In the Solution, this value is set to
3, which sorts the data by the
“Term of Office” column.
The display:caption tag renders the table caption
displayed above the column headers:
<display:caption>United States Presidents</display:caption>
The display:column tag specifies information about
each column to be displayed:
<display:column property="firstName" title="First Name"
                sortable="true"/>
The property attribute specifies the JavaBean
property that holds the data for the column. The
title attribute specifies the text to display in
the column header. The sortable attribute
specifies if the data can be sorted by this column. If this value is
set to true, then clicking the column header will sort the data by
that column.
The display tag library provides functionality
for exporting displayed
tabular data to XML, Excel
spreadsheets, and comma-separated value (.csv)
files. This functionality can be enabled by registering some servlet
filters provided with the library. Then you set the
export attribute of the
display:table tag to true. The documentation
provided with display tags has all the details on setting up the
export capability.
See Also
Complete details on the display tag library can be found at its web site: http://displaytag.sourceforge.net. Recipe 4.3, Recipe 4.4, and Recipe 4.5 show how to provide similar functionality. While these “roll your own” recipes may not be necessary if you’re using the display tags, they will help you understand how the functionality is implemented.
Get Jakarta Struts Cookbook now with the O’Reilly learning platform.
O’Reilly members experience books, live events, courses curated by job role, and more from O’Reilly and nearly 200 top publishers.

