Non-Normal Distributions
In the previous example, we generated samples conditional on a set of parameters given by μ and V assuming that these default probabilities were distributed multivariate normal. Next, we use this basic setup again in the form of a Gaussian copula. But, for now, let's revisit the experiment once again and focus on the last step, which involves NORMDIST. Recall that this step produced a cumulative probability under the normal cumulative density that we used in our subsequent analysis on credit defaults. Let's change the object of interest to portfolio loss, specifically the probability that returns would be less than or equal to some critical loss value. The underlying assumption again is that returns are multivariate normal. What if, instead, we felt that they were distributed non-normally?
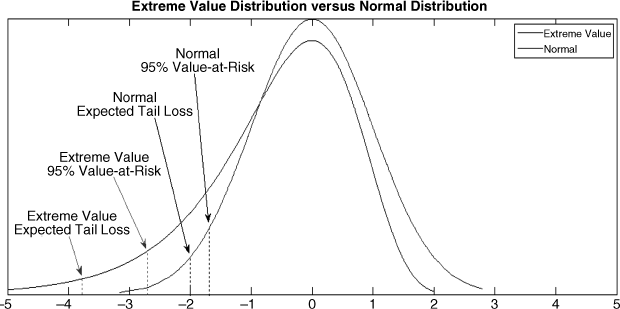
Consider, for example, the possibility that the returns have fat tails implying the likelihood of more extreme returns compared to the normal density. This is illustrated conceptually further on for the case in which the normal density underestimates the likelihood of losses in general and extreme losses in particular. In this case, the normal density would underestimate both VaR and ETL if the true distribution of returns followed some type of extreme value distribution (in this case, one that is skewed left with a fatter tail).

Suppose we felt that distributions of returns ...
Get Investment Theory and Risk Management, + Website now with the O’Reilly learning platform.
O’Reilly members experience books, live events, courses curated by job role, and more from O’Reilly and nearly 200 top publishers.

