Performance Attribution
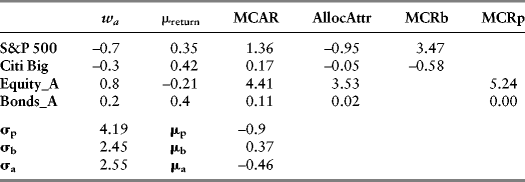
The following summarizes some relevant parameter values and performance statistics.
Table 10.1 Performance Summary and Parameter Values.

The first column obviously shows the short position in the benchmark and the equity tilt in the active portfolio. The second column shows the average monthly returns to the benchmark and active portfolios during the evaluation period. Note the negative return to the active equity portfolio. The third column contains the marginal contributions to active risk (MCAR). These tell us how active risk changes on the margin for a 1 percent increase in the allocation to the portfolio in question. The active risk σa is equal to 2.55 percent (monthly). The allocation to equity in the active portfolio is 0.8. Since MCAR is a derivative, ![]() , it returns the change in active risk (from 2.55 percent) for a one-unit change in the active weight (0.8 to 1.8). We need to rescale this weight change for it to make sense. Thus, a change from 0.8 to 0.9 (dwa = 0.10, in this case) implies a change in active risk of 0.441, which bumps σa to 2.99 percent.
, it returns the change in active risk (from 2.55 percent) for a one-unit change in the active weight (0.8 to 1.8). We need to rescale this weight change for it to make sense. Thus, a change from 0.8 to 0.9 (dwa = 0.10, in this case) implies a change in active risk of 0.441, which bumps σa to 2.99 percent.
This is a powerful feature of risk management. It tells us how our portfolio risk changes along the margins. Obviously, active risk is much more sensitive to small changes in the allocation to the active ...
Get Investment Theory and Risk Management, + Website now with the O’Reilly learning platform.
O’Reilly members experience books, live events, courses curated by job role, and more from O’Reilly and nearly 200 top publishers.

