Appendix 5.1: Statistical Review
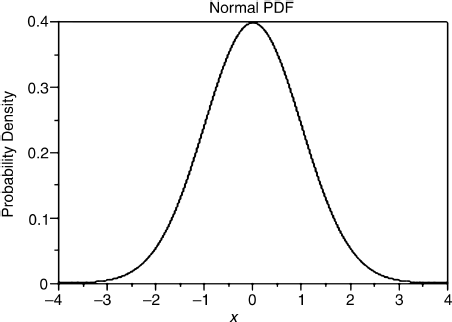
Asset returns are not perfectly anticipated. Therefore, they are modeled as draws from an underlying probability distribution (for example, the Normal density with mean return μ and variance σ2). The probability distribution describes the riskiness of returns. For example, if returns are normally distributed, then observed returns will have a relatively high likelihood of being close to the average, or central tendency of the distribution and, consequently, would have a low likelihood of taking on extreme values in the tails of the distribution. The following is a picture of the standard normal density for the random variable ![]() . The likelihood is higher for values of z closer to the mean (zero) than for extreme values.
. The likelihood is higher for values of z closer to the mean (zero) than for extreme values.
We can therefore think of a random draw as having an expected value that corresponds to some notion of central tendency. Thus, the expected value of a random variable is some kind of average of all its possible outcomes. Figure 5.1 is such an example—the expected values of the random payoffs are weighted averages of their possible outcomes. In repeated draws, we would expect an outcome to be represented by:
![]()
Here, fi is the relative frequency ...
Get Investment Theory and Risk Management, + Website now with the O’Reilly learning platform.
O’Reilly members experience books, live events, courses curated by job role, and more from O’Reilly and nearly 200 top publishers.

