11
REGRESSION
With correlation, all we can measure is the relative strength of an association and whether it is statistically significant. With regression, we can model that association in a linear form and predict values of Y given the values of X.
After completing this chapter, you will be able to
- specify the equation format for a simple linear regression model,
- define residuals (errors),
- fit a linear regression line by eye,
- describe how fitting the regression line by minimizing residuals works,
- use the fitted regression model to make predictions of y, based on the values of x,
- interpret residual plots,
- determine the confidence interval for the slope of a regression line.
The simple form of a linear regression model is as follows:
y = ax + b
We read this as “y equals a times x, plus a constant b.” You will note that this is the equation for a line with slope a and intercept b. The value a is also termed the coefficient for x (Figure 11.1). The constant b is where the regression line intersects the y-axis and is also called the y-intercept.
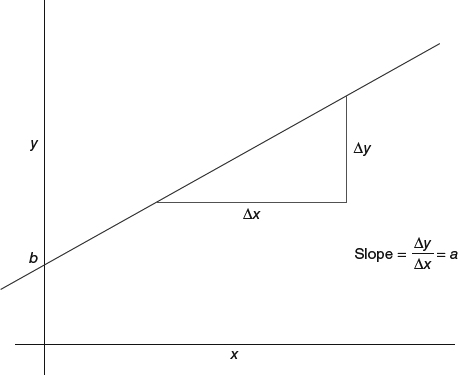
Figure 11.1 Slope and intercept of a line.
11.1 FINDING THE REGRESSION LINE BY EYE
Using the baseball payroll example and assuming that a correlation exists between the payroll amount in dollars and the number of wins over three seasons, can we predict wins based on a given payroll amount?
On the basis of Figure 11.2, it appears that an ...
Get Introductory Statistics and Analytics: A Resampling Perspective now with the O’Reilly learning platform.
O’Reilly members experience books, live events, courses curated by job role, and more from O’Reilly and nearly 200 top publishers.

