Contour Line Files
Another way of representing elevation on a map, familiar to you from your examination of the topographic map, is through “isolines” or “contour lines.” For any given such line, every position on that line is supposed to represent the same elevation. The contour lines you have seen so far have been “printed” on the DRG, but a GIS can represent these lines as data as well.
____ 51. While still zoomed up on the reservoir, turn off all layers except COLE_DEM. Add the feature class cole_contours_lines from
[___]IGIS-Arc\River\Kentucky_River_Area_Data.mdb\Quadrangle_data
using a Fire Red line of width 1. Start Identify tool and set its window menu so it shows cole_contours_line. Adjust the Identify Results window so that you can see all the attributes. (MapTips will still show the DEM values.) Click the map. Investigate the contours around Reservoir 4 by clicking individual contour lines. See Figure 2-34. What is the name of the field in the attribute table that specifies the elevations of the contours? ________________. Notice how it is helpful that the feature you click is highlighted briefly. What is the contour interval (the number of feet measured vertically between adjacent contour lines)? __________ feet. Turn off the DEM.
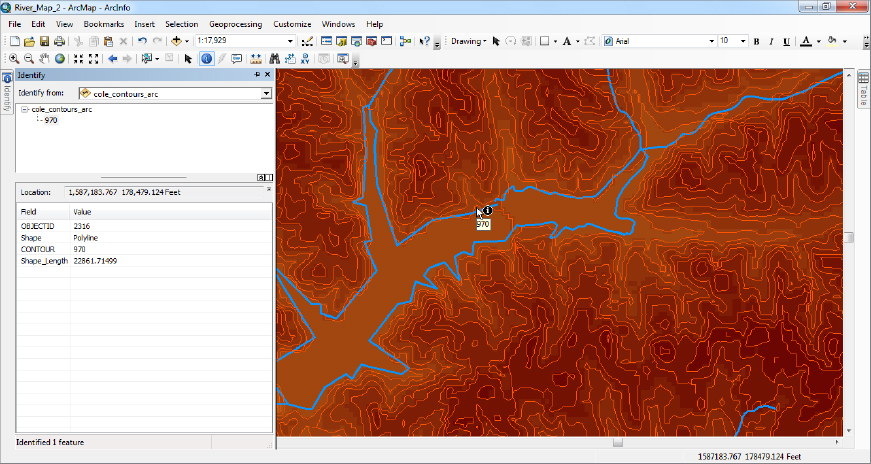
____ 52. Turn on the DRG layer. Use the Identify tool to compare the elevation values of the red contour lines with those ...
Get Introducing Geographic Information Systems with ArcGIS: A Workbook Approach to Learning GIS, 3rd Edition now with the O’Reilly learning platform.
O’Reilly members experience books, live events, courses curated by job role, and more from O’Reilly and nearly 200 top publishers.

