The Raster Data Model
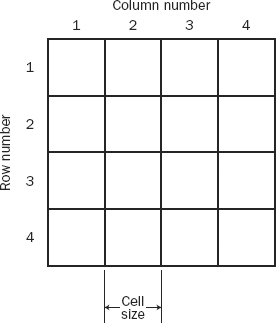
One way of systematically dividing up an area of interest is shown in Figure 4-3. Here, regularly spaced horizontal and vertical lines, like those that generate the squares of a chess board, make a grid that creates relatively small areas called cells. In the past, and sometimes currently, the practice was to index each cell by a row number and a column number. Generally, the top (north-most) row was numbered one (1) and the left (west-most) column was numbered one (1). More recently the indexing has shifted to strictly geographic coordinates. In this case, the coordinates of the center of the southwest-most (lower-left) cell are specified by the easting and northing of (usually) the center of that cell. The horizontal and vertical lines are parallel to the x- and y-axes of the coordinate system. Since the cell size is known, the coordinates of the center of any cell may be easily calculated.
FIGURE 4-3 A basic raster that allows storage of categorical data
If the person deciding on the spacing between the grid lines has done a good job, and the overall area being depicted is cooperative, the user will frequently be able to know, for each cell, what feature or condition most occupies the cell, thus answering the “what” question. Actually, several issues, to be addressed later, come into play in determining the “what,” when, as will frequently be the case, ...
Get Introducing Geographic Information Systems with ArcGIS: A Workbook Approach to Learning GIS, 3rd Edition now with the O’Reilly learning platform.
O’Reilly members experience books, live events, courses curated by job role, and more from O’Reilly and nearly 200 top publishers.

